
4 Key On-Chain Indicators to Determine if the Bitcoin Price Has Bottomed
In the crypto ecosystem, pinpointing the exact moment Bitcoin (BTC) prices bottom out is akin to finding a needle in a haystack. Recent data, however, provides some insights into whether the Bitcoin price has bottomed.
As the digital currency touched a one-month low of $58,500, analysts from CryptoQuant and Glassnode revealed four crucial on-chain indicators to watch. These indicators could be useful for analyzing market behaviors near the low points and understanding the conditions necessary for prices to rebound and rise once more.
1. Tracking Bitcoin Demand Growth
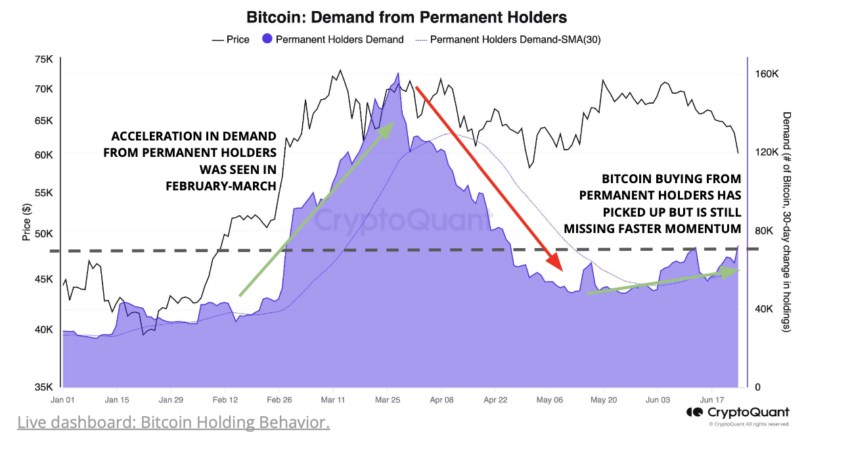
The first quarter of 2024 saw a remarkable surge in Bitcoin demand coinciding with the launch of US spot ETFs, establishing record highs. However, post-May, this demand has seen a significant slowdown.
To determine whether Bitcoin has bottomed, it’s vital to observe if the demand from permanent holders, who are now buying at a rate of 72,000 Bitcoin per month, can return to or exceed the early 2024 levels. A resurgence to these levels is essential for a sustainable price rally.
Read more: Bitcoin (BTC) Price Prediction 2024/2025/2030
Apart from the demand side, Glassnode’s analysis reveals significant insights into the behavior of Long-term Holders (LTHs), who play a crucial role from the supply side as well. LTHs typically distribute coins and take profits during bull markets, helping to establish market cycle tops.
Currently, the market is witnessing a regime where LTH divestment is moderated. This indicates a move toward equilibrium rather than euphoria, which is a phase when the unrealized profits of LTHs are more than 250%. The high profits motivate LTHs to sell BTC aggressively, marking a market top.
The current equilibrium phase suggests that while LTHs are not yet ready to offload their holdings massively, they are also not accumulating at a pace, thus providing a balanced supply dynamic in the market.
2. Assessing the Profitability of Traders
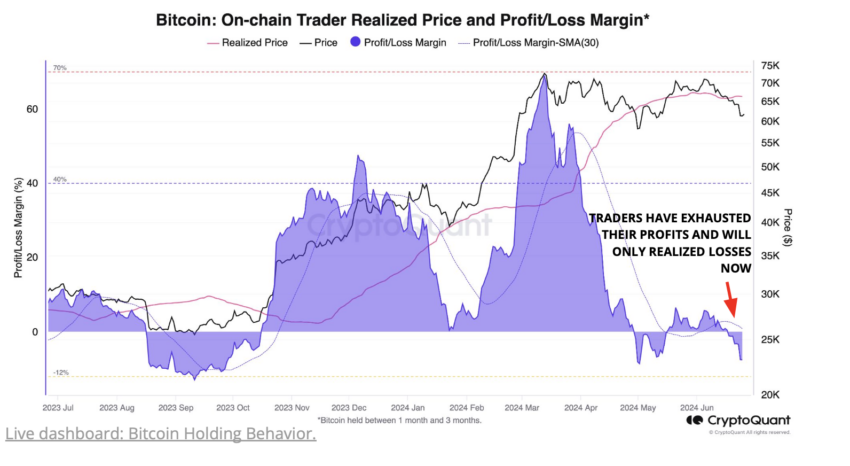
Another indicator is the profitability of traders. Currently, on-chain unrealized margins for traders are in the negative, suggesting reduced selling pressure but not necessarily a readiness for a price rebound.
For a bullish signal, these margins need to turn positive and rise above their 30-day simple moving average.
“Since mid-June, the spot price has plunged below the cost basis of both the 1-week to 1-month-old holders ($68,500) and 1-month to 3-month-old holders ($66,400). If this structure persists, it has historically resulted in a deterioration of investor confidence and risks this correction being deeper and taking longer to recover from,” Glassnode said.
Read more: 8 Best On-Chain Analysis Tools in 2024
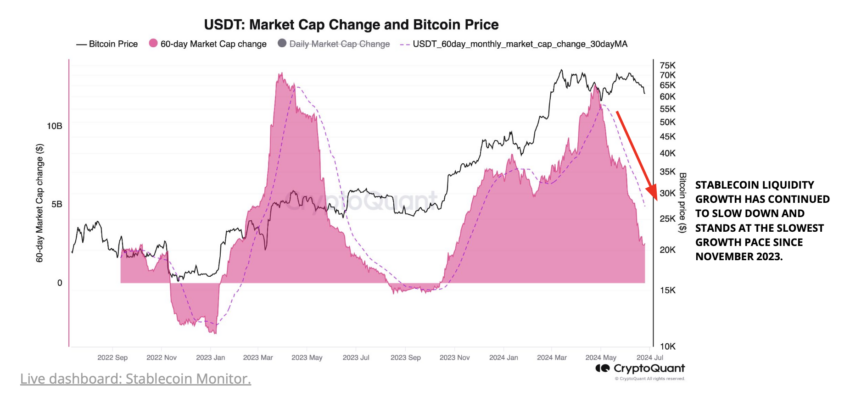
3. Evaluating Stablecoin Liquidity
The growth in Tether’s USDT market capitalization is a proxy for liquidity in the cryptocurrency market. After peaking at $12.6 billion in late April, the growth over the past 60 days has slowed dramatically to just $2.5 billion, marking the slowest pace since November 2023.
An acceleration in stablecoin liquidity is essential for Bitcoin prices to rally. This will provide the market with the needed capital inflow to support higher price levels.
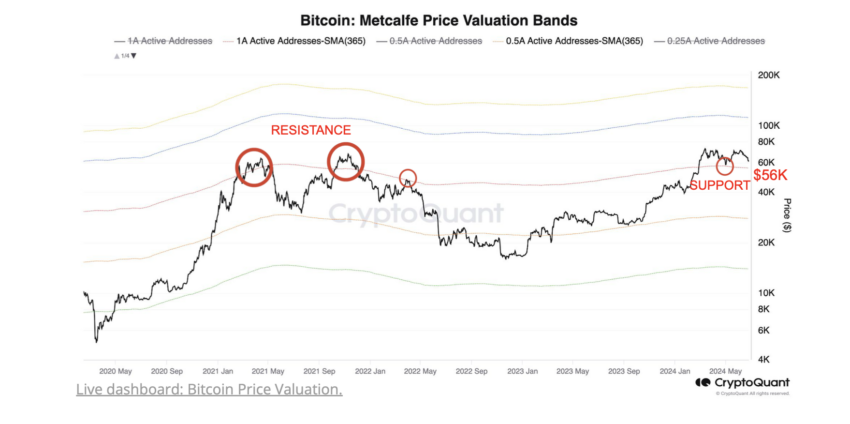
4. Monitoring the Ultimate Bitcoin Price Support Level
The final indicator to watch is Bitcoin’s support level, currently pegged at $56,000 based on Metcalfe’s price valuation bands.
“This valuation is based on the Metcalfe law that states the value of a network is proportional to the number of users in the network,” CryptoQuant explains.
This level has historically acted as both resistance and support in previous cycles. It also provided support to Bitcoin when its price dropped to around $56,500 in May 2024. A drop below this critical support could signal a significant market correction while maintaining above this level could suggest the market has bottomed.
Read more: How To Evaluate Cryptocurrencies with On-chain & Fundamental Analysis
Amid these technical indicators, social sentiment is also showing signs that the market may believe the bottom has been reached. Analysis from Santiment highlighted a spike in social volume and dominance for the term “bottom,” suggesting a growing belief among investors and traders that Bitcoin’s price may not fall further.
However, the market often tends to go against the retail sentiments. Hence, traders and investors should consider the nuances carefully and do their own research before building new market positions.
The post 4 Key On-Chain Indicators to Determine if the Bitcoin Price Has Bottomed appeared first on BeInCrypto.