

Bitcoin Slips Below 1-Day SMA: Is BTC Heading For Fresh Lows? | Bitcoinist.com
Bitcoin (BTC), the leading cryptocurrency by market capitalization, is facing renewed bearish pressure as its price falls below the 1-day Simple Moving Average (SMA). This technical indicator, widely used by traders to gauge market trends, signals a potential continuation of the downward trajectory for BTC.
As Bitcoin targets new lows, the breach of the 1-day SMA underscores increasing bearish sentiment and heightened volatility in the market. Investors and analysts are closely monitoring this development, as it may indicate further declines and set the stage for Bitcoin to test lower support levels.
With a market capitalization of more than $1.3 trillion and a trading volume of more than $25 billion as of the time of writing, the price of Bitcoin is currently down by 1.49%, trading at around $66,133 in the last 24 hours. BTC market cap and trading volume are currently down by 1.52% and 4.84% respectively.
Bitcoin Market Sentiment Turns Bearish
On the 4-hour chart, the price of BTC looks bearish as it is currently trading below the 100-day simple moving average. It can also be observed here that Bitcoin is attempting a further move towards the $64,515 support level.
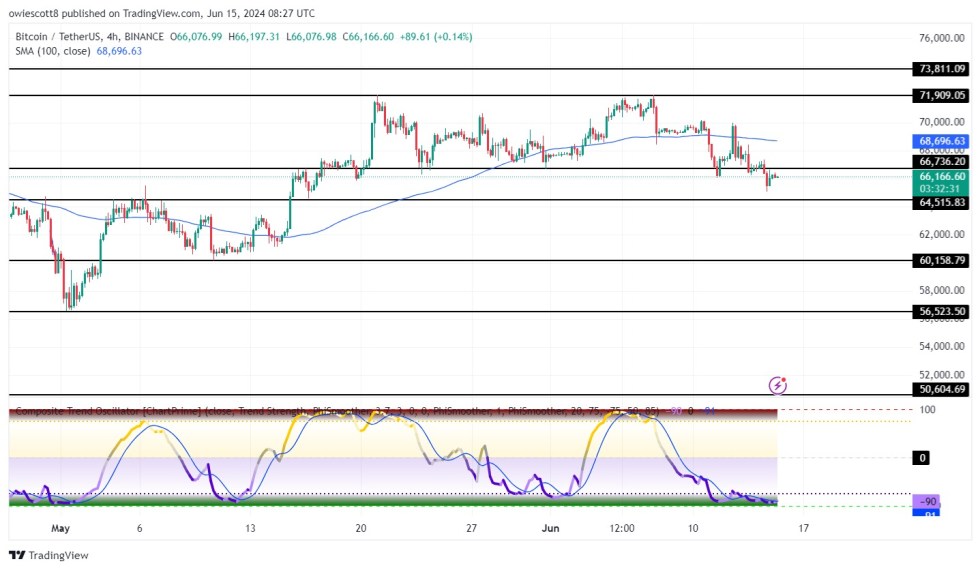
The composite trend oscillator on the 4-hour chart also signals a bearish sign as both the signal line and SMA of the indicator are currently trending in the oversold zone. As it stands now, those two will linger there for a while thereby sending the price bearish.
A careful look at BTC price movement on the 1-day chart shows that there is always a successful break of the price below the 100-day SMA. Currently, the crypto asset seems to be attempting a short-term retracement before dropping further.
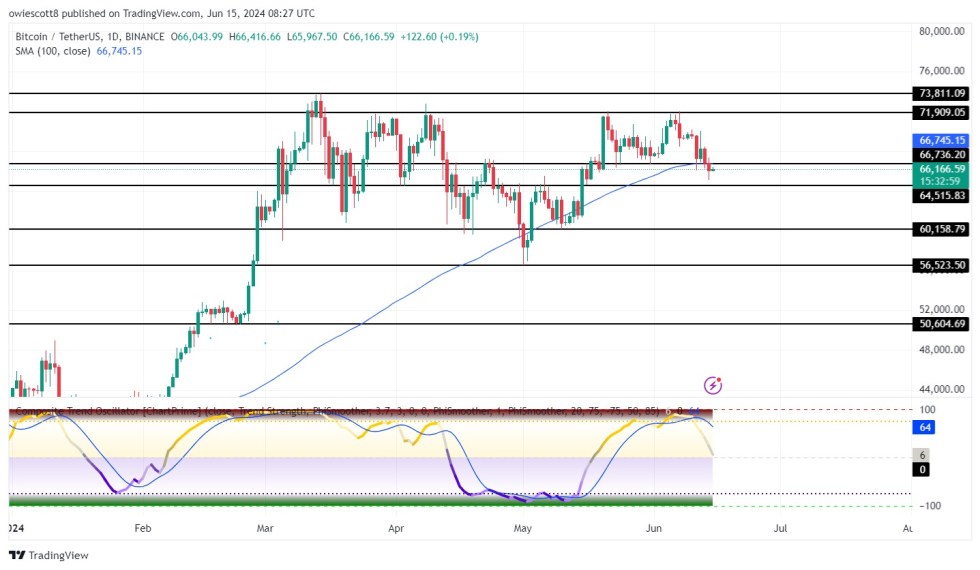
Additionally, the formation of the 1-Day Composite Trend Oscillator signals a bearish fall ahead as both the signal line and the SMA of the indicator after crossing each other are descending towards the zero line and could drop below this point.
Key Support Levels To Watch
Currently, there are four key support levels $64,515, $60,158, $56,523, and $50,604 to look out for respectively. If the price of Bitcoin continues bearish as predicted, it will start to move downward toward the $64,515 support level. In the event of a break below this level, BTC will decline further to test the $60,158 level and possibly other support levels.
However, given that the digital asset fails to decline further as predicted and decides to start a move upward, it will begin to move toward the $71,909 resistance level. It could move even higher to challenge the $73,811 resistance level if it breaks above the aforementioned level and possibly moves on to create a new high.
Featured image from iStock, chart from Tradingview.com