

Chainlink (LINK) Analysis: Key Support and Resistance Levels Identified
In this analysis, we will identify support and resistance levels within the Chainlink (LINK) market, drawing insights from recent price movements, Exponential Moving Averages (EMAs), and volume profile analysis.
By deeply examining these key indicators, we aim to provide actionable insights and strategic recommendations for traders looking to enhance their trading approach and capitalize on the dynamics of the LINK market.
Chainlink 4H Price Analysis
During the four-hour timeframe, the price of LINK has reverted below the 50 EMA (in Violet), a previously crucial resistance line. Unlike other cryptocurrencies like Bitcoin, LINK has shown no bullish indicators.
Since reaching its June high of nearly $19, LINK’s price has been undergoing a correction.
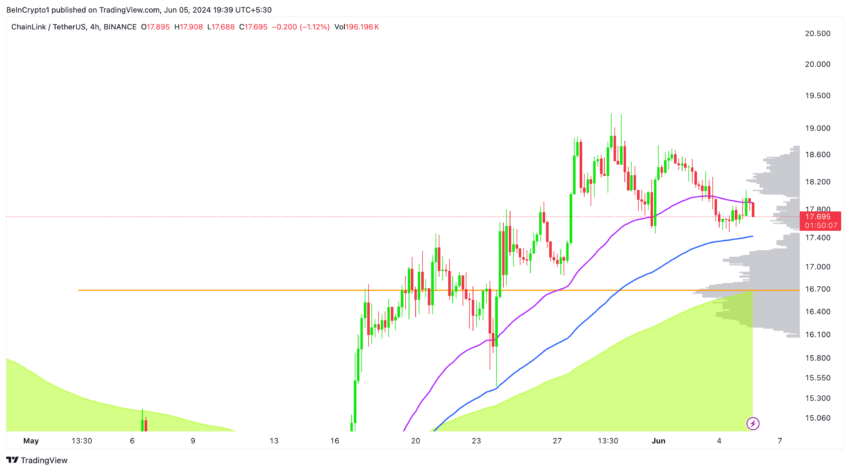
The price is currently positioned between the 50 EMA and the 100 EMA (in Blue), with the latter potentially serving as a significant support level in the mid-term. Furthermore, the price remains well above the 200 EMA (Green Area) in this timeframe, indicating a continued bullish outlook for the long term.
The volume profile indicates that the $16.7 support line could be a significant support level if LINK breaches the 100 EMA at $17.4.
Read More: How To Buy Chainlink (LINK) and Everything You Need To Know
Chainlink 1H Price Analysis
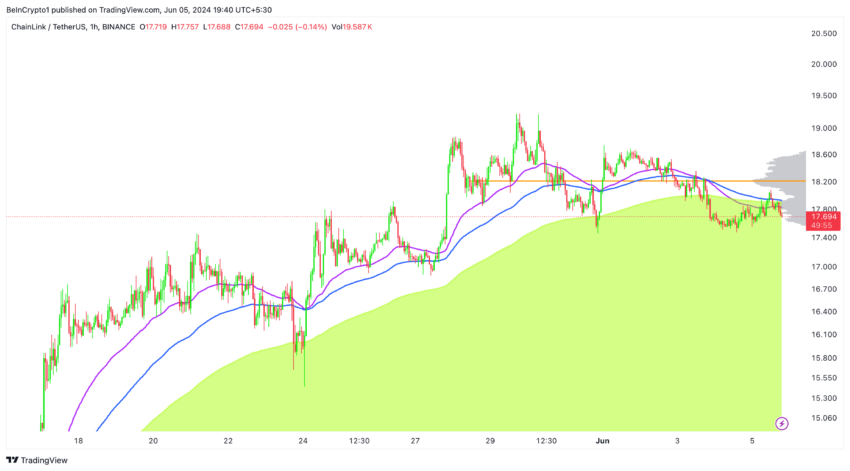
In the one-hour timeframe, Chainlink has faced notable challenges in its attempt to ascend beyond the 200 EMA area. Despite multiple attempts to breach this critical threshold, the price has consistently retraced, indicating strong selling pressure in this region.
Presently, the price finds itself positioned below all three EMAs—the 50, 100, and 200. This configuration not only underscores the current bearish sentiment but also suggests formidable hurdles for any potential upward movement.
Looking ahead, these EMAs will likely serve as significant resistance levels in the mid-term, exerting further downward pressure on the price of Chainlink. Moreover, the volume profile resistance range, specifically at $18.2, adds another layer of resistance, reinforcing the importance of this price level in limiting upward momentum.
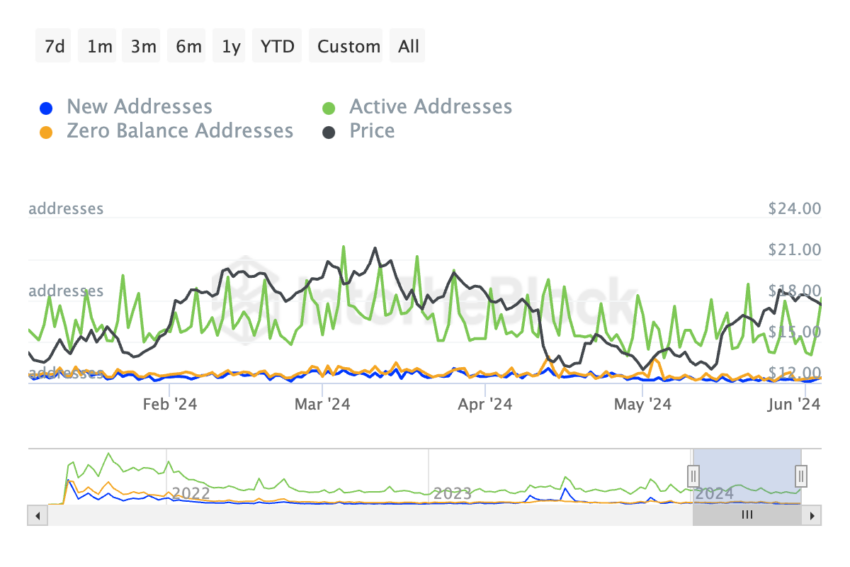
Chainlink’s Active Addresses Are on the Rise
Looking at the fundamentals, the increase in active addresses shows strong network activity.
Heightened engagement, such as an uptick in the utilization of active addresses or transactions within a network like Chainlink, may be construed as a bullish indication for several reasons:
Network Expansion: Elevated activity typically hints at a burgeoning user community or heightened acceptance of the platform’s offerings. This implies a broader user base, potentially driving up demand for the associated cryptocurrency (specifically, LINK).
Service Demand: Chainlink primarily provides decentralized Oracle services, facilitating the integration of real-world data into smart contracts across diverse blockchain platforms. Heightened activity might signify an increased need for these services, bolstering the utility and attractiveness of the Chainlink network.
Market Sentiment: Escalating engagement has the potential to sway market sentiment, indicating faith in the project and its prospects for future development. Investors and traders might interpret the surge in activity as a positive signal regarding the network’s viability and growth potential, prompting heightened investment and upward price movements.
This suggests that the recent dip from $19 to where it is now is mainly due to market dynamics.
So, it’s likely LINK will drop below $18 before picking up steam again. If Bitcoin keeps breaking records, LINK could even climb to $20 or $22.
Strategic Recommendations
Utilize Support and Resistance Analysis: Incorporate support and resistance levels identified from technical analysis into trading strategies. Utilize support levels, such as the 100 EMA (4H) and the support line at $16.7 (4H), as reference points for establishing stop-loss orders and identifying potential entry opportunities during price retracements.
Similarly, recognize resistance levels, such as the 50/ 100/ 200 EMAs (4H) and the volume profile resistance range at $18.2 (1H), to gauge potential areas of bullish price reversal and adjust trading positions accordingly.
Read More: Chainlink (LINK) Price Prediction 2024/2025/2030
Dynamic Position Management: Implement dynamic position management techniques based on support and resistance levels to optimize risk-reward ratios. Consider scaling into positions near support levels to capitalize on potential price rebounds while scaling out of positions near resistance levels to secure profits and minimize exposure to downside risk.
Continuously monitor price action around these key levels to adapt trading strategies in response to changing market conditions.
Risk Mitigation Strategies: Utilize support and resistance analysis to enhance risk mitigation strategies and protect trading capital. Set stop-loss orders below significant support levels to limit potential losses in the event of a breakdown, while trailing stop orders can be employed to lock in profits as prices approach resistance levels.
By incorporating these risk management techniques, traders can effectively manage downside risk and preserve capital in volatile market environments.
The post Chainlink (LINK) Analysis: Key Support and Resistance Levels Identified appeared first on BeInCrypto.