

Chainlink (LINK) Breaks Below Key Support, Signaling Potential Downtrend
After a dramatic 13% correction on Friday, Chainlink has shattered key support levels, leaving traders and investors on edge.
The question on everyone’s mind is: what comes next for Chainlink? With a bearish cloud hanging over the market and Bitcoin’s price struggling below $70,000, understanding the technical landscape has never been more crucial.
Chainlink Breaks Key Levels on 4-Hour Chart
The price of LINK has turned bearish after a 13% correction on Friday.
LINK has broken key support levels, notably $17.40, which corresponds to the 100 EMA (Blue line) on the 4-hour chart. The volume profile peaks at $16.70.
The price has also entered the green zone, corresponding to the 200 EMA on the 4-hour chart. This area is anchored to the volume profile peak (Yellow line) of $16.70.
The $16.70 and $18.00 price levels remain strong resistance points. Given the current market conditions with Bitcoin trading below $70,000. LINK is likely to struggle to break through these levels.
Read More: How To Buy Chainlink (LINK) and Everything You Need To Know
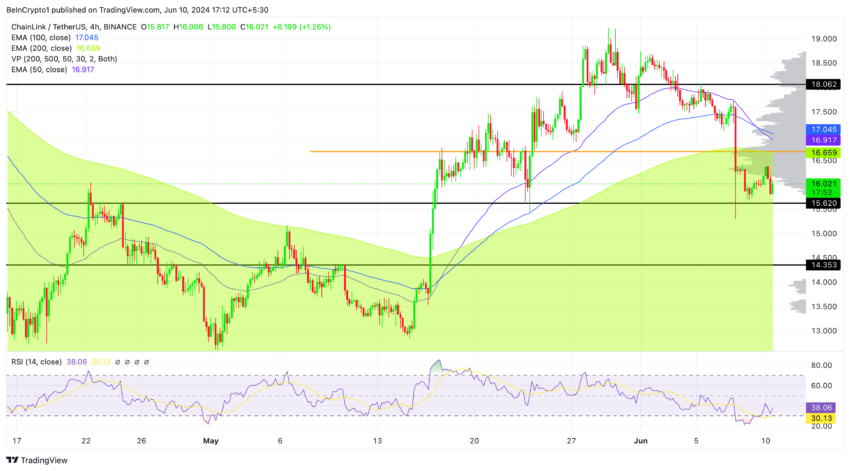
The most important support levels to watch at this price level are $15.60 and $14.30.
These levels correspond to the significant flat baselines of the Ichimoku Cloud on the 4-hour timeframe. Providing key areas of potential support amid the current bearish trend.
LINK Price Analysis: Daily Bearish Outlook
On the daily price action, Chainlink has entered the Ichimoku Cloud, indicating a very bearish signal. The RSI has also dropped significantly from 70 to 43 within this time frame.
LINK is currently finding strong support at the 200-day exponential moving average (green area).
Such a move would likely see the price heading straight to the lower boundary of the red Ichimoku Cloud on the daily timeframe, around $14.30. This $14.30 level is a critical support point, and a continuation down to this level would indicate a bearish trend.
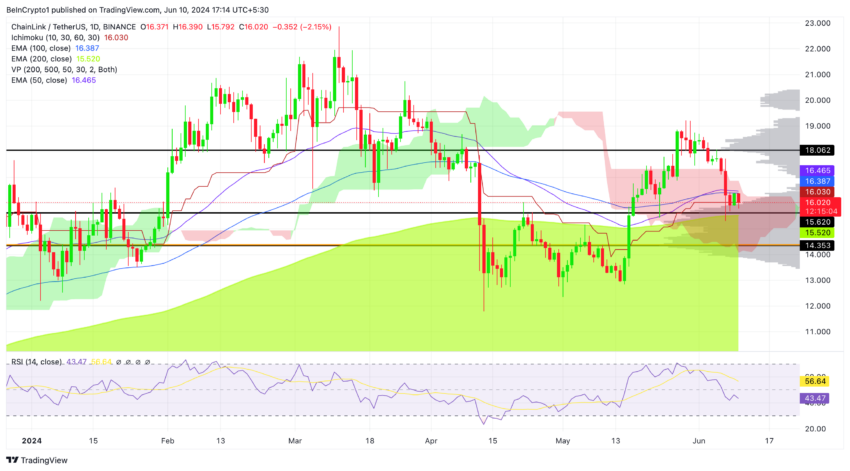
If the price breaks this level (EMA 200) and breaches the $15.60 support level, LINK could be very bearish. The mid-term resistance level is located at the daily 50 EMA and 100 EMA, within the $16.30 – $16.50 price range.
If the price rises above these levels (50 & 100 EMAs), it could present an optimistic technical scenario for LINK, potentially pushing LINK above the Ichimoku Cloud, which would be a positive bullish sign for the mid-term outlook.
Read More: Chainlink (LINK) Price Prediction 2024/2025/2030
Given the current market conditions, with Bitcoin trading below $70,000, LINK will likely struggle to break through the $16.70 resistance level.
Monitoring these key support levels ($15.6 and $14.3) can help traders make informed decisions and manage risk effectively.
Additionally, the decline in LINK’s price, now trading 30% below its local high from March 2024, suggests the potential for further declines. Therefore, keeping a close eye on the market and adjusting strategies accordingly is crucial.
The post Chainlink (LINK) Breaks Below Key Support, Signaling Potential Downtrend appeared first on BeInCrypto.