

Injective (INJ) Shows Bullish Signs: Technical and Fundamental Insights
The recent price action of Injective (INJ) has demonstrated notable upward momentum, particularly over the past 10 daily trading candles.
As of the latest daily candle, the price of INJ closed at $30.13, reflecting a minor pullback of 3.55%.
Injective Daily Price Action Validates Prior Insights
In a recent analysis, BeInCrypto predicted that Injective (INJ) could penetrate the daily Ichimoku cloud, signaling strong buy signals. This prediction has proven accurate as INJ has successfully broken through the cloud and is now trading at $30, with a peak at $33.
Positioned above both the 100 EMA (blue) at $28.55 and the 200 EMA (green) at $27.70, INJ shows signs of a bullish trend continuation. The price action suggests that the support levels provided by these EMAs have held strong, underpinning the recent rally.
Over the last 10 bars, INJ has experienced a consistent upward trajectory, with a breakout from the Ichimoku Cloud, indicating strong bullish sentiment.
Read More: 9 Cryptocurrencies Offering the Highest Staking Yields (APY) in 2024
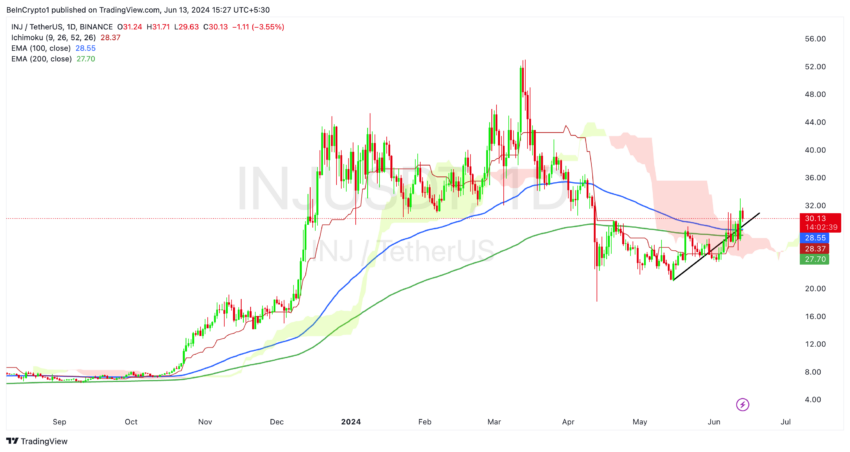
The sharp price rise initiated around the $25 mark, followed by a steady ascent, culminating in a test of the $32 resistance level. The formation of higher highs and higher lows further consolidates this bullish outlook.
However, today’s retracement signals potential profit-taking or a minor consolidation before the next leg up.
Technical analysts would note the recent crossing above the Ichimoku Cloud as a significant bullish indicator. Coupled with the price holding above the key EMA, Injective (INJ) signals strong buy signals. Traders should monitor for any signs of reversal or continued consolidation, which could provide further buying opportunities at lower levels.
Injective Active Addresses: A Bullish Signal
From June 1 to June 12, Injective experienced significant fluctuations in daily active addresses, reflecting varying levels of user engagement and network activity.
The period started strong, with a notable 5% increase on June 2. It was followed by consistent growth, reaching a peak increase of 6.19% on June 7. These gains indicate heightened interest and participation within the network.
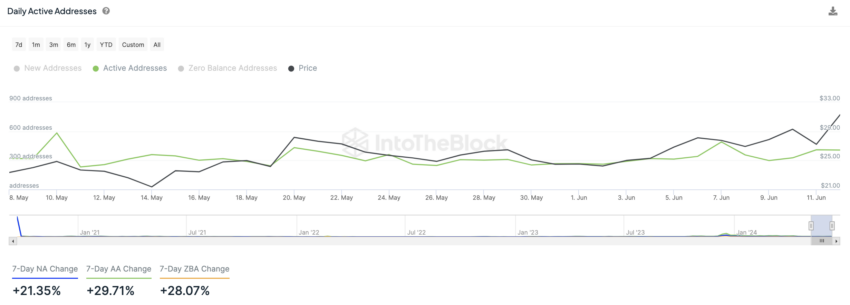
Despite a few minor declines, such as the 2.68% drop on June 5 and the 1.60% dip on June 9. The overall trend remained upward. By June 12, daily active addresses rose to 1,310, underscoring the network’s resilience and the strong bullish sentiment surrounding INJ.
Daily active addresses represent the number of unique addresses participating in daily transactions on the Injective network. This metric is crucial for gauging network activity and user engagement.
Increasing active addresses generally signifies growing interest and utilization, reflecting positive sentiment and potential for further price appreciation.
Transaction Sizes and Trends
The Injective protocol has demonstrated considerable fluctuations in average transaction sizes over the past month, along with notable price movements. This analysis examines the average transaction size, the 7-day moving average (7D MA) of the transaction size, and corresponding price trends.
During the initial period from May 12 to May 18, the average transaction size began at 10,856.62 on May 12, peaking dramatically at $198,395.87 on May 17, before dropping to $2,539.73 on May 18.
Prices moved from $21.35 to $24.97, reflecting moderate market volatility. The 7-day moving average (7D MA) starts at $34,892.51, indicating the early trends in transaction sizes.
Read More: Top 9 Web3 Projects That Are Revolutionizing the Industry
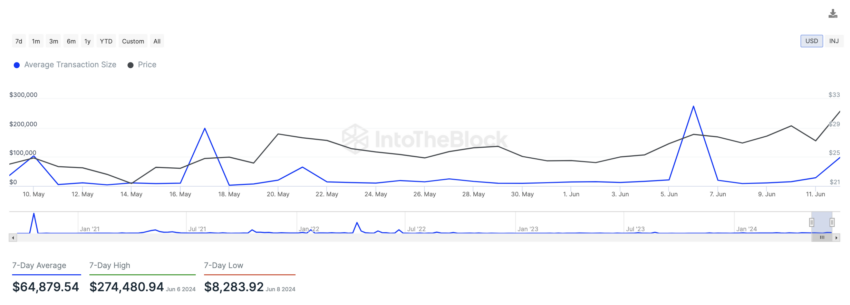
In the mid-period from May 19 to June 4, a significant peak was observed on May 21, with an average transaction size of $64,952.34, indicating increased market activity and interest.
Prices saw an upward trend during this time, reaching a high of $28.16 on May 20. The 7D MA gradually decreased after May 21, stabilizing around $14,644.66 by May 3. Providing a smoothed view of the fluctuating transaction sizes.
The recent period from June 5 to June 12 saw a noteworthy spike on June 6, with the average transaction size soaring to $274,480.94, the highest in this dataset. Prices responded by hitting $28.10, suggesting a potential correlation between transaction size spikes and price increases.
By June 12, the 7D MA had escalated to $64,879.54. Illustrating a sustained increase in average transaction sizes towards the end of the period. This sustained rise suggests continued market interest and potentially increasing adoption or trading activity within the network.
With both technical indicators and fundamental metrics aligning positively, Injective (INJ) shows strong buy signals for continued bullish momentum.
The post Injective (INJ) Shows Bullish Signs: Technical and Fundamental Insights appeared first on BeInCrypto.