

Mantra (OM) Reaches All-Time High at $1.45, Eyes Bigger Gains
OM, the native token of the real-world asset (RWA) Layer-1 (L1) blockchain Mantra, has reached a new all-time high, currently trading at $1.47. It has seen a 7% price increase in the past 24 hours, during which its trading volume surged by 78% to total $40 million.
OM has defied the broader market trend, maintaining an upward trajectory even as the wider market has declined in recent weeks. As a result, its price has skyrocketed by 63% over the past 30 days.
MANTRA’s October Mainnet Launch Drives Price Growth
The anticipated launch of the MANTRA Chain Mainnet has fueled OM’s parabolic price rise over the past month. BeinCrypto reported earlier that this is scheduled to take place in October.
Notably, the anticipation around this launch has shielded OM from the broader market downturn caused by the political unrest in the Middle East. While many assets have seen their prices plunge by double digits in the past week, OM’s value has maintained its upward trend.
However, many market participants’ current fearful state has eroded their confidence in OM’s sustained price growth, as evidenced by its predominantly negative funding rate.
Read more: How To Invest in Real-World Crypto Assets (RWA)?
An asset’s funding rate refers to the periodic payment that ensures that its perpetual contract price stays close to its spot price. When it is negative, it indicates that many traders are betting against the asset, suggesting they expect a decline.
When this occurs during a price rally, it often leads to a short squeeze, as seen in OM’s case. On Monday alone, OM’s short liquidations reached $648,000, marking the highest single-day amount since July 15.
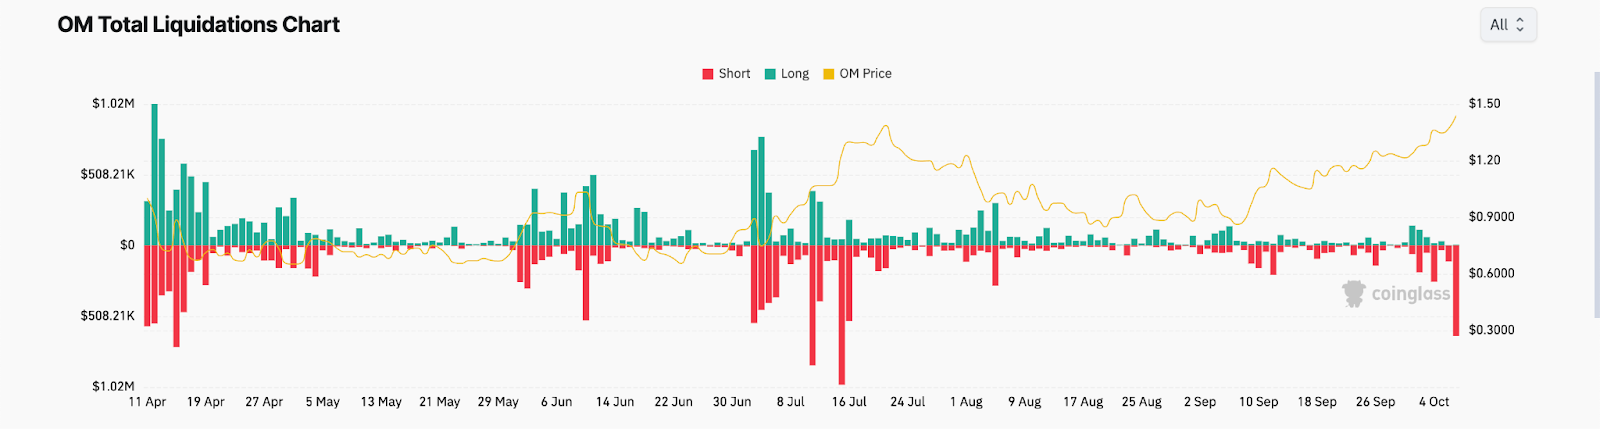
During a short squeeze, short sellers are forced to buy back their positions to limit losses as the price rises. This buying pressure furthers drives up the coin’s value despite the negative funding rate.
OM Price Prediction: Coin Gears For More
At its current value, OM’s price sits significantly above its 20-day exponential moving average (EMA), which measures its average trading price over the past 20 trading days. This is a bullish signal, highlighting the high demand for OM.
If an asset’s price remains consistently above the 20-day EMA, buyers are in control, and the asset is in an uptrend. Some traders may see this as a signal to buy, anticipating further price increases. If the buyers remain in control, OM’s price may rise to a new high.
However, it is imperative to note that the OM market is overheated. Readings from its Relative Strength Index (RSI) confirm this. This indicator, which measures an asset’s overbought or oversold nature, is at 75.91 at press time.
Read more: What is The Impact of Real World Asset (RWA) Tokenization?
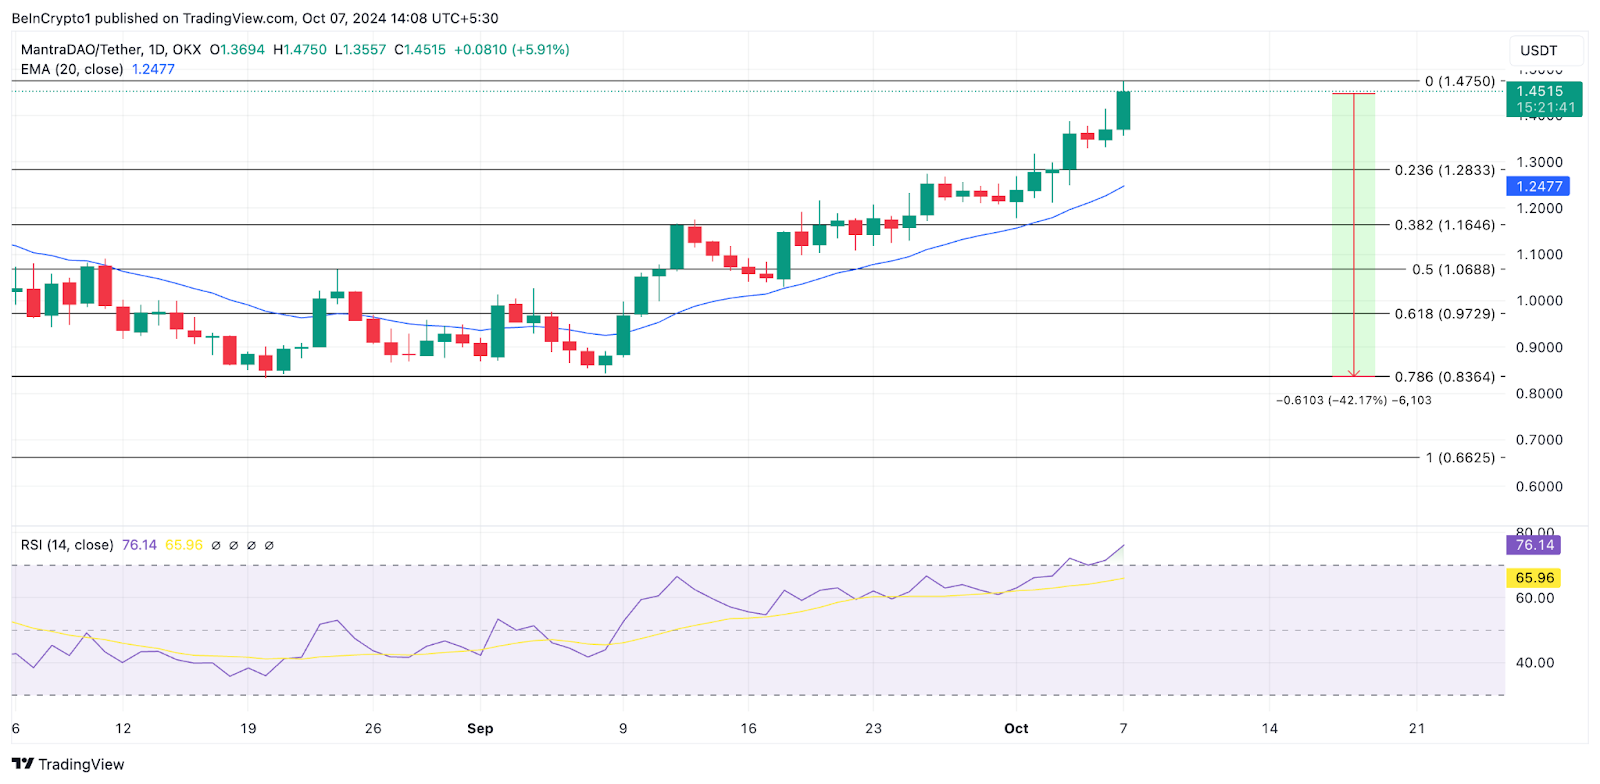
An RSI value of 75.91 signals that an asset is overbought and may be due for a price correction. If OM reverses its current trend and buying pressure weakens, its price may decline by 42% toward support formed at $0.83.
The post Mantra (OM) Reaches All-Time High at $1.45, Eyes Bigger Gains appeared first on BeInCrypto.