

Solana (SOL) Trends Below Breakout Level as Bears Re-Emerge
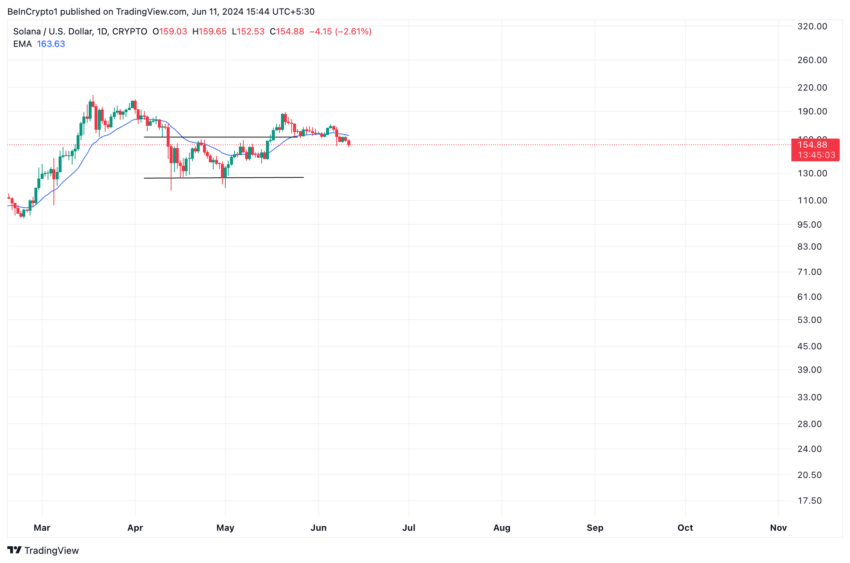
Solana (SOL) trended within a horizontal channel between April 13 and May 15. As buying pressure gained momentum, the bulls initiated a rally above the upper line of this channel, and SOL broke above that level on 16 May.
The surge in demand for the altcoin pushed its price to $187 on May 20, where it peaked. However, it has since trended downward and fallen back below the breakout level of $162.
Solana Price Dip Continues
At press time, Solana (SOL) trades at $154. It has fallen 5% below the breakout level. The altcoin currently trades below its 20-day Exponential Moving Average (EMA).
This tracks SOL’s average price over the past 20 days. When an asset’s price falls below this key moving average, it means that the asset trades at a level lower than its average price over the past 20 days. This signals a decline in buying pressure and a rally in coin sell-offs.
Readings from SOL’s Moving Average Convergence Divergence (MACD) confirmed the surge in selling pressure among market participants. The coin’s MACD line (blue) currently rested below the signal (orange) and trended toward the zero line as of this writing.
This indicator identifies an asset’s price strength, direction, and momentum changes. When the MACD line crosses below the Signal line, it is considered a bearish signal. It suggests that the bears have taken control and will put downward pressure on the asset’s price.
Read More: What Is Solana (SOL)?
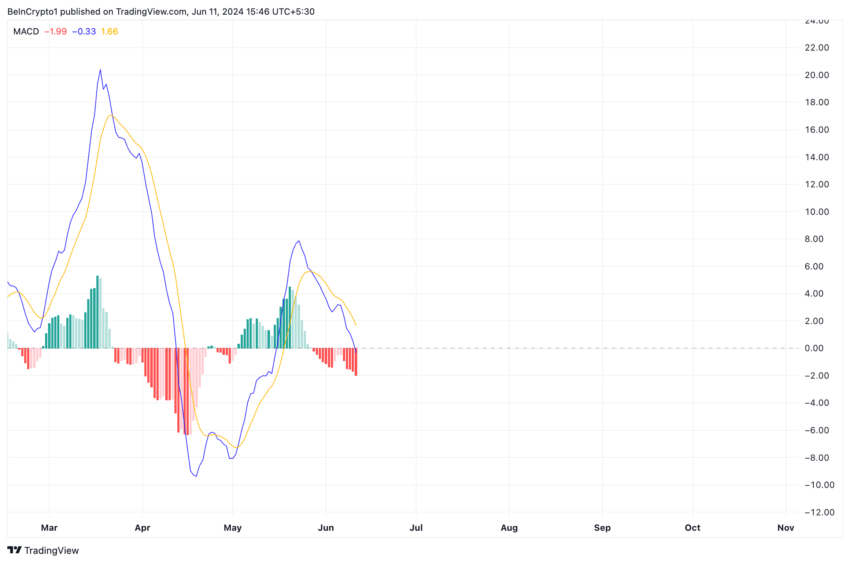
Traders often interpret it as a sign to exit short and take long positions.
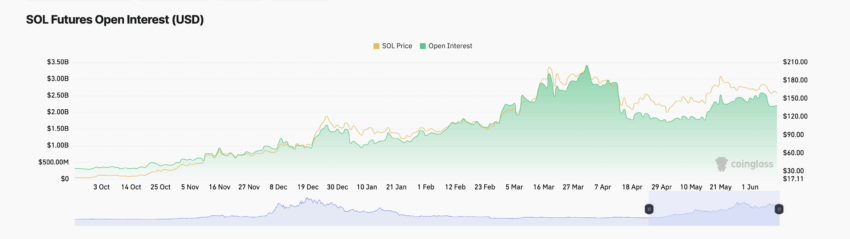
SOL Price Prediction: Futures Traders Close Out Positions
The bias is no different amongst the coin’s futures market traders. Since the beginning of June, SOL’s futures open interest has trended down. At $2.2 billion, it has since declined by 15%.
An asset’s futures open interest tracks the total number of outstanding futures contracts or positions that have not been closed or settled. When it declines in this manner, it suggests an uptick in the number of traders closing their positions without opening new ones.
It is often considered an indicator of a shift in sentiment from bullish to bearish.
SOL’s negative weighted sentiment confirms this shift. At press time, it was below zero at -0.32. This on-chain metric tracks the overall market sentiment regarding an asset. At this value, SOL’s weighted sentiment suggests that there are more negative mentions than positive mentions surrounding it.
If this bias remains against the coin and selling pressure gains momentum as a result, its value may drop to $135.
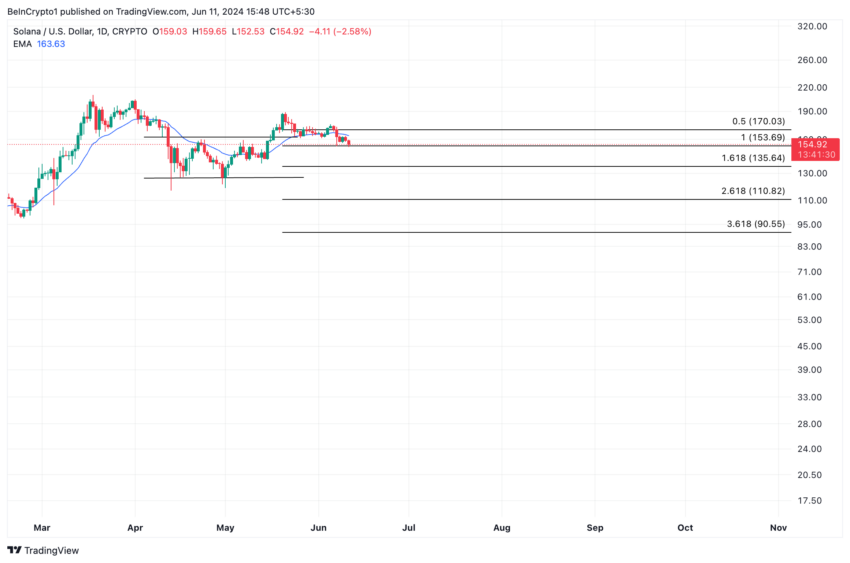
However, if the bulls force a takeover and buying pressure spikes, SOL’s price may rally toward $17.03.
The post Solana (SOL) Trends Below Breakout Level as Bears Re-Emerge appeared first on BeInCrypto.