
Bitcoin (BTC) Weekly Price Closes Above $50,000 for the First Time Since 2021 – $60,000 Next?
The Bitcoin (BTC) price reached a new yearly high of $52,800 on February 15 but has fallen slightly since.
Nevertheless, BTC regained its footing on February 15 and is approaching its yearly high. Will it break out?
Bitcoin Closes Above $50,000
The weekly time frame outlook shows the BTC price has increased since the start of 2023. The upward movement accelerated in October, leading to a high of $49,050 in January 2024.
The BTC price fell afterward, validating the 0.618 Fib retracement level as resistance (red icon) and leading to a decrease to $38,500.
However, the Bitcoin price regained footing and has created four weekly bullish candlesticks. This culminated with a Bitcoin weekly close of $52,900 last week, the highest since 2021.
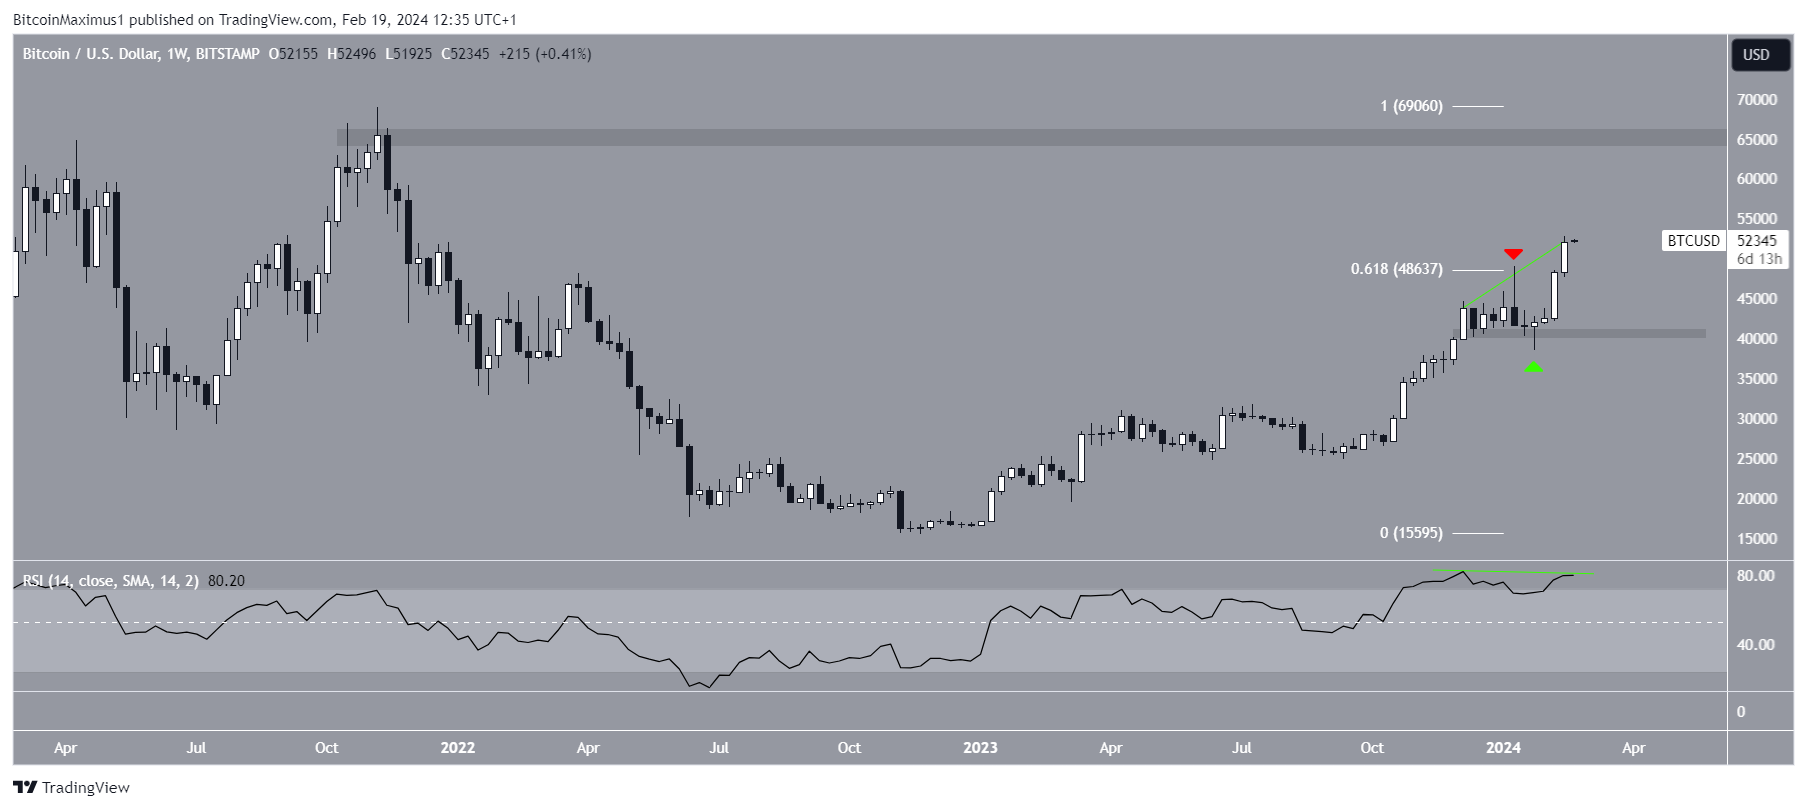
Despite the bullish price action, the weekly Relative Strength Index (RSI) shows bearish signs. The RSI is a momentum indicator traders use to evaluate whether a market is overbought or oversold and whether to accumulate or sell an asset.
Readings above 50 and an upward trend suggest that bulls still have an advantage, while readings below 50 indicate the opposite. While the RSI is increasing, it has also generated a bearish divergence, often preceding bearish trend reversals.
Read More: Where To Trade Bitcoin Futures
What Are Analysts Saying?
Cryptocurrency traders and analysts on X positively view the future BTC trend.
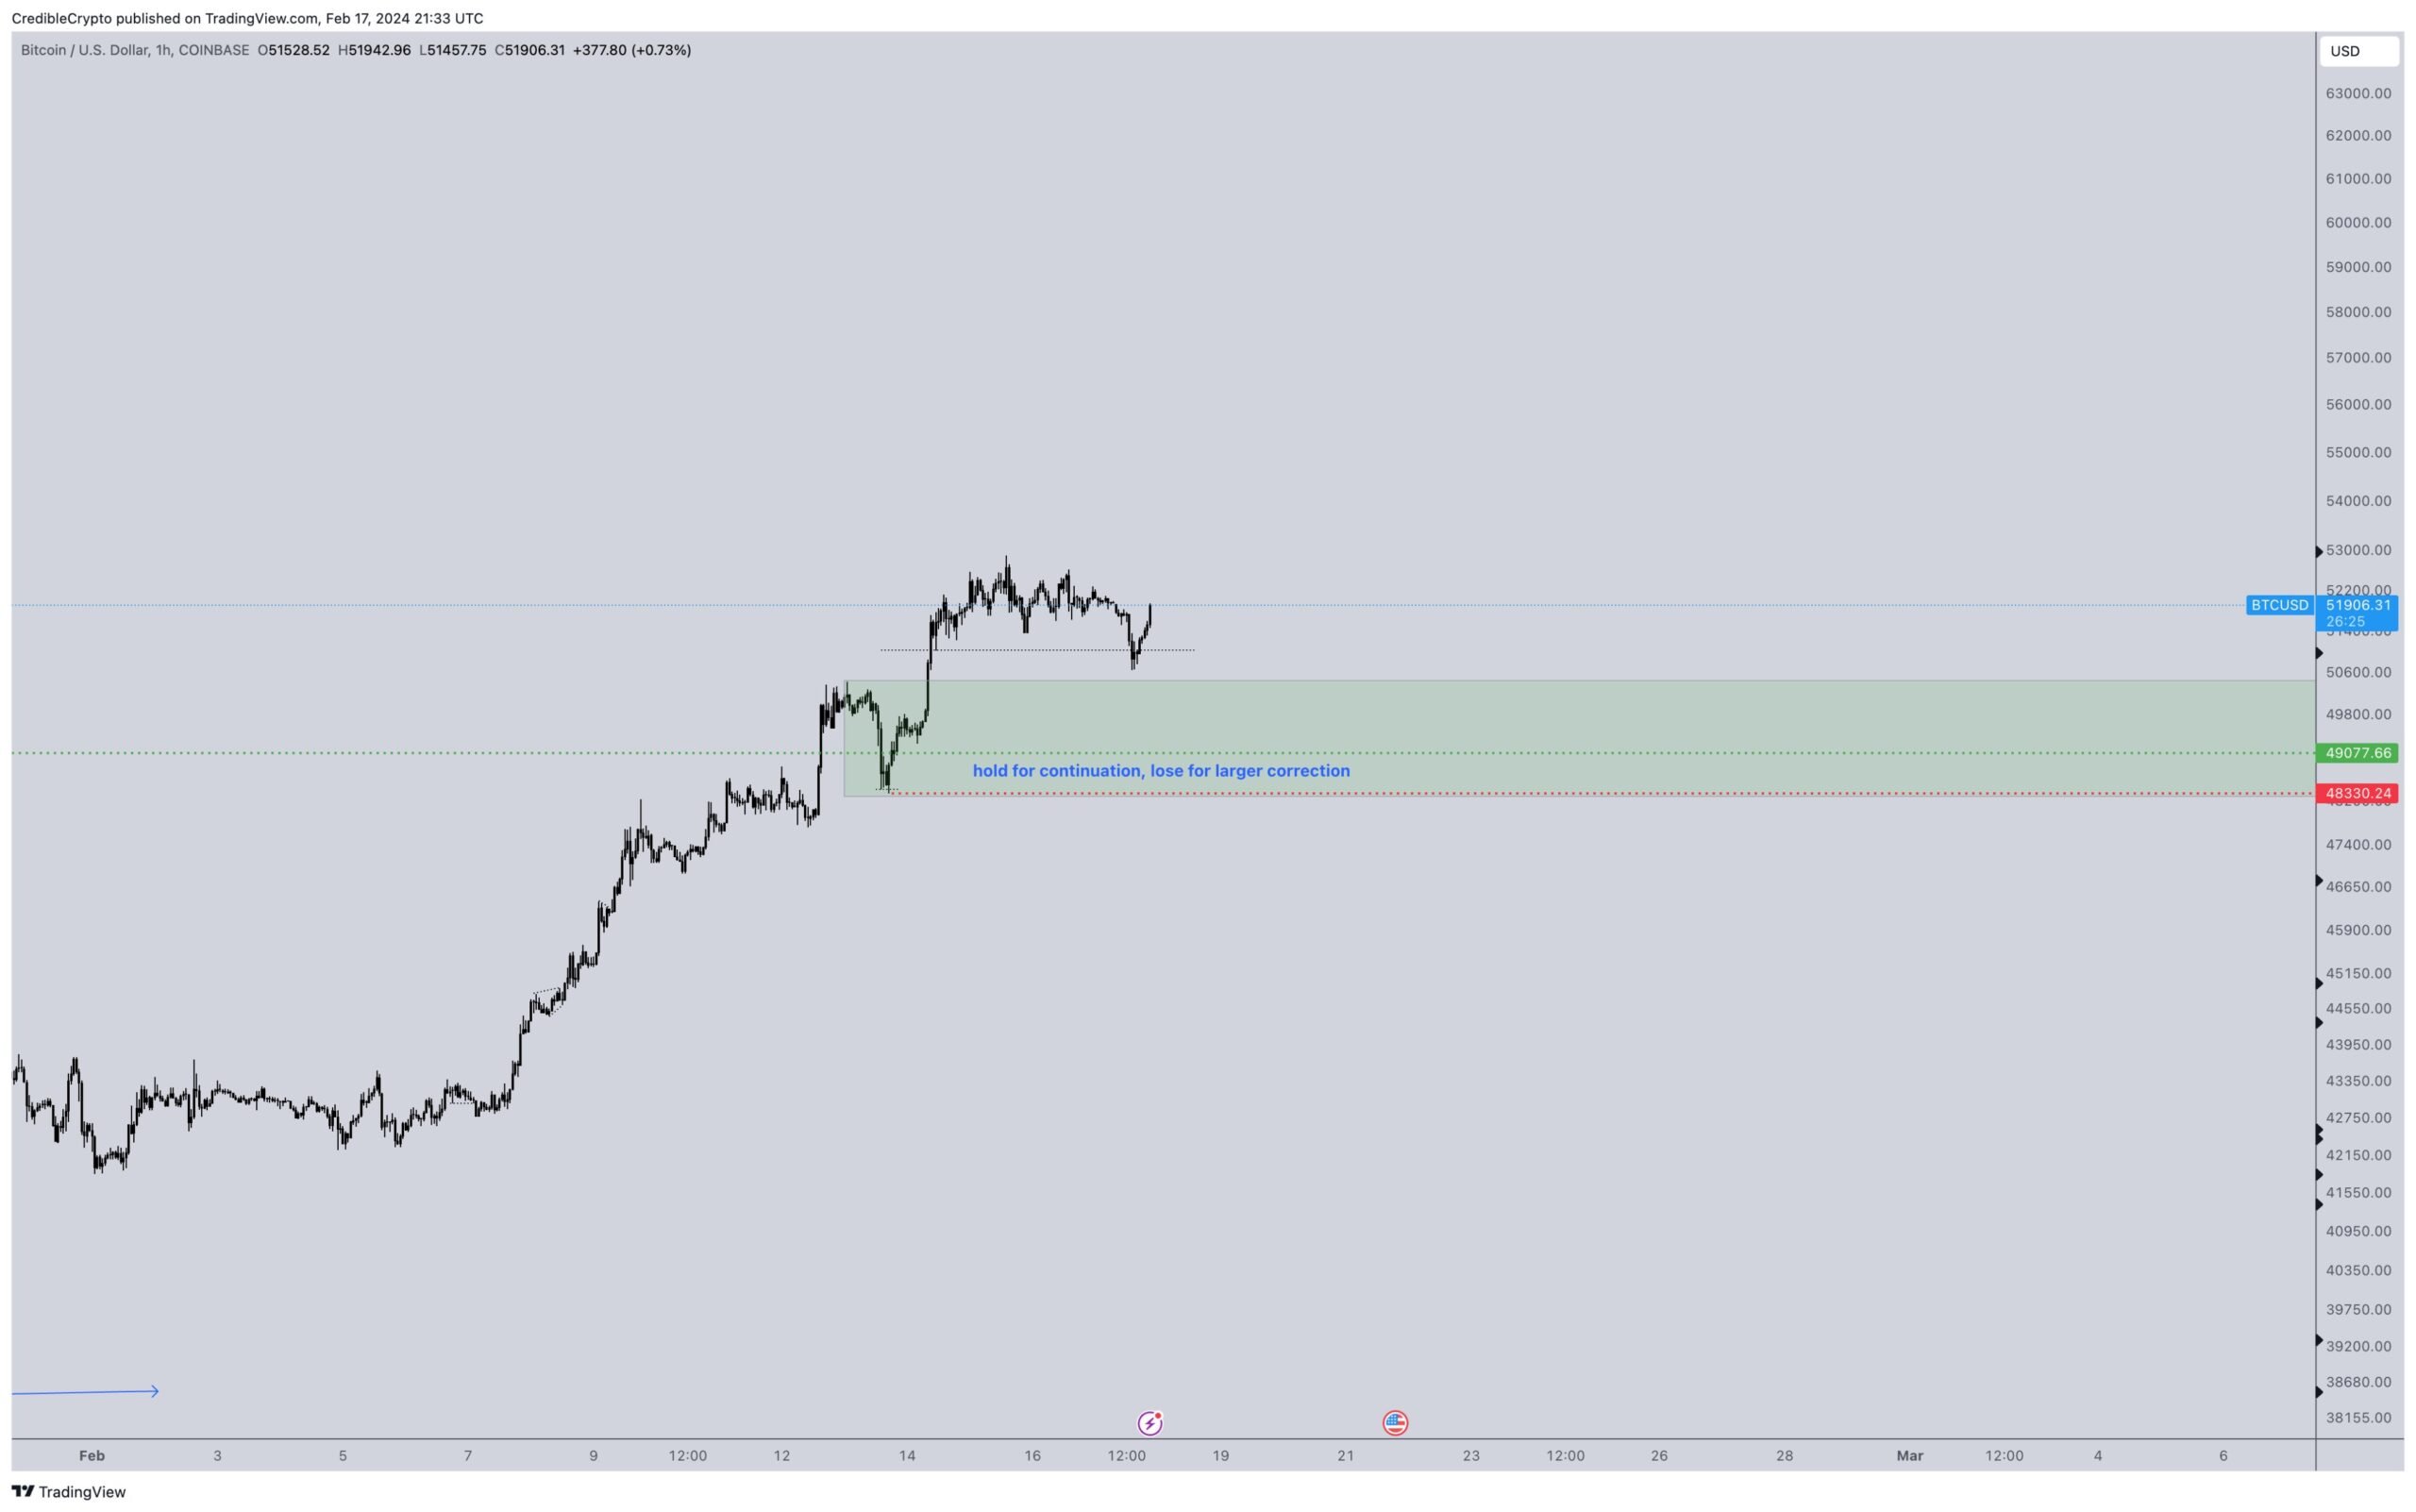
CryptoMichNL believes the BTC price will reach $100,000 before halving. CrediBULL Crypto suggests the price can retest $50,000 before moving higher.
“Really though I still think decent chance we test it- even if we go for the local highs first. Ideally we can form a nice range between new local highs and the green zone- that would be great to establish/compound positions.” He stated.
Matthew Hyland noted this is the first time the BTC price has closed above the long-term 0.618 Fib retracement resistance level before halving.
Read More: Who Owns the Most Bitcoin in 2024?
BTC Price Prediction: Is Local Top Close?
The technical analysis of the 12-hour time frame supports the increase because of the BTC price action, wave count, and RSI readings.
The price action shows that BTC trades above the 1.27 external Fib retracement of the previous decrease at $51,800, which is now expected to provide support.
This bullish movement is supported by the RSI, which has generated a hidden bullish divergence (green) and is increasing.
Finally, the wave count suggests BTC has another high left before a correction. Utilizing the Elliott Wave theory, technical analysts examine long-term price patterns and investor psychology that recur to determine the direction of a trend.
Read More: What is a Bitcoin ETF?
The most likely count suggests that BTC is in wave three of a five-wave upward movement (white). The sub-wave count is in black, showing the price in the fifth and final sub-wave.
The most likely level for the top of the upward movement is at $56,000, created by the 1.61 external Fib retracement resistance level of the previous decrease. It is nearly 7% above the current price. Afterward, the BTC price could correct in what is wave four.
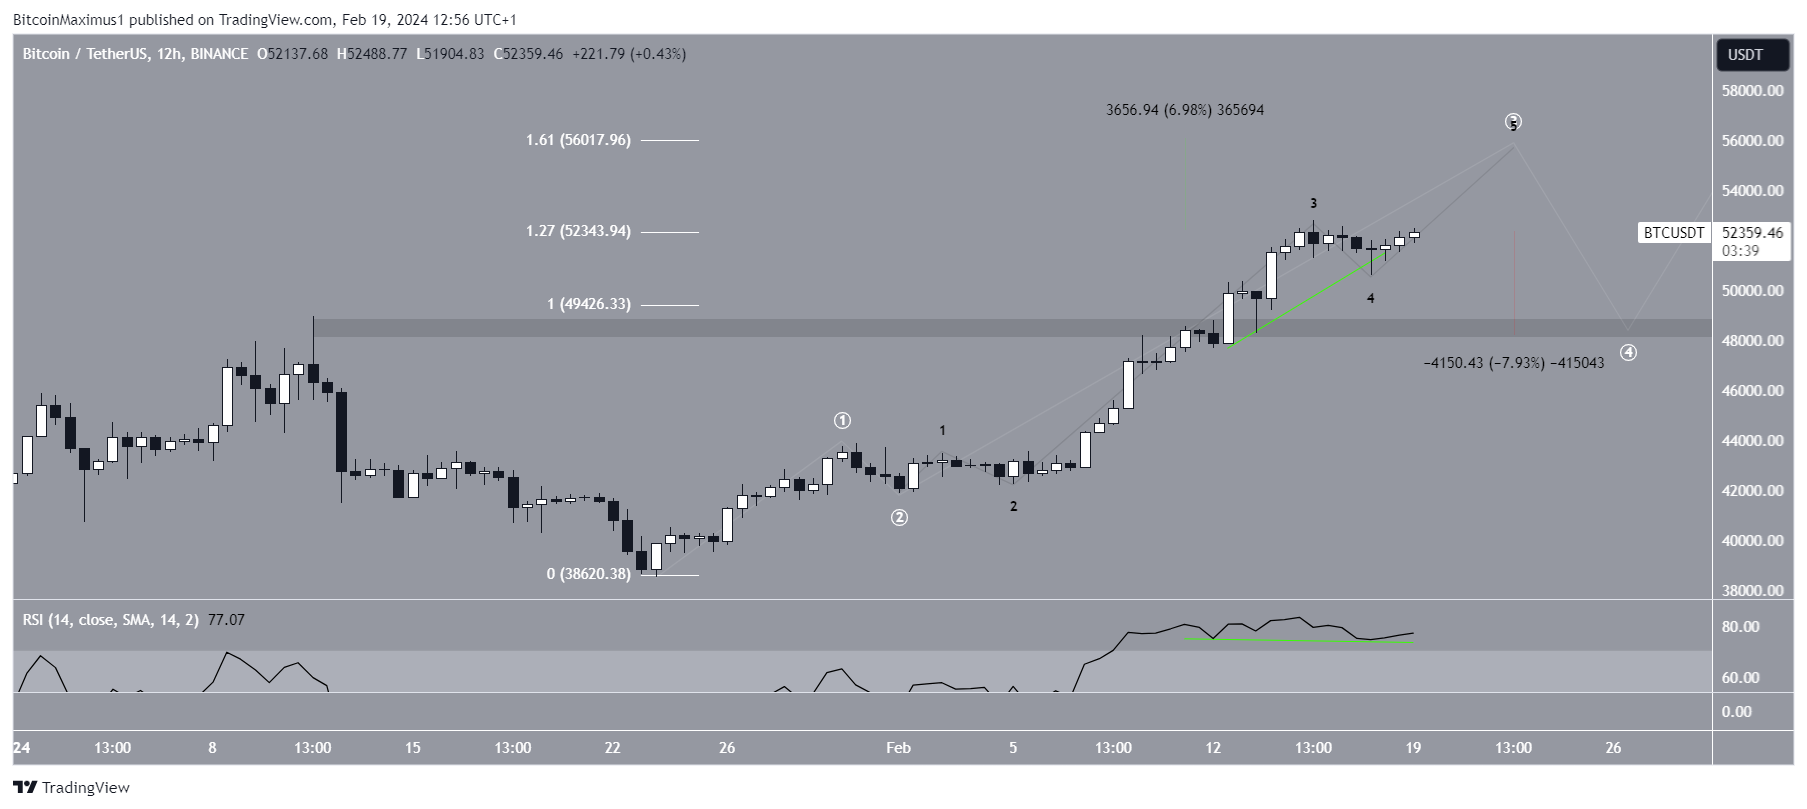
Despite the bullish BTC price prediction, if Bitcoin fails to close above the $52,350 resistance area, wave three will end. This will trigger an 8% drop to the closest support at $49,000.
For BeInCrypto‘s latest crypto market analysis, click here.
The post Bitcoin (BTC) Weekly Price Closes Above $50,000 for the First Time Since 2021 – $60,000 Next? appeared first on BeInCrypto.