

Cardano (ADA) Stalls at $0.50 Resistance – What’s in Store for February?
The Cardano (ADA) price has fallen under a descending resistance trend line since its yearly high of $0.69 in December 2023.
ADA broke down from a short-term diagonal support level but trades above a long-term horizontal one.
Cardano Approaches Decisive Level
The technical analysis of the daily time frame shows that ADA has fallen under a descending resistance trend line since December 2023. The decrease culminated with a low of $0.45 on January 23, 2024.
While this seemingly caused a breakdown from a critical horizontal support area, ADA reclaimed it afterward and made an unsuccessful breakout attempt (red icon) from the descending resistance trend line.
The ADA price is quickly approaching the point of convergence between the resistance trend line and the horizontal support area.
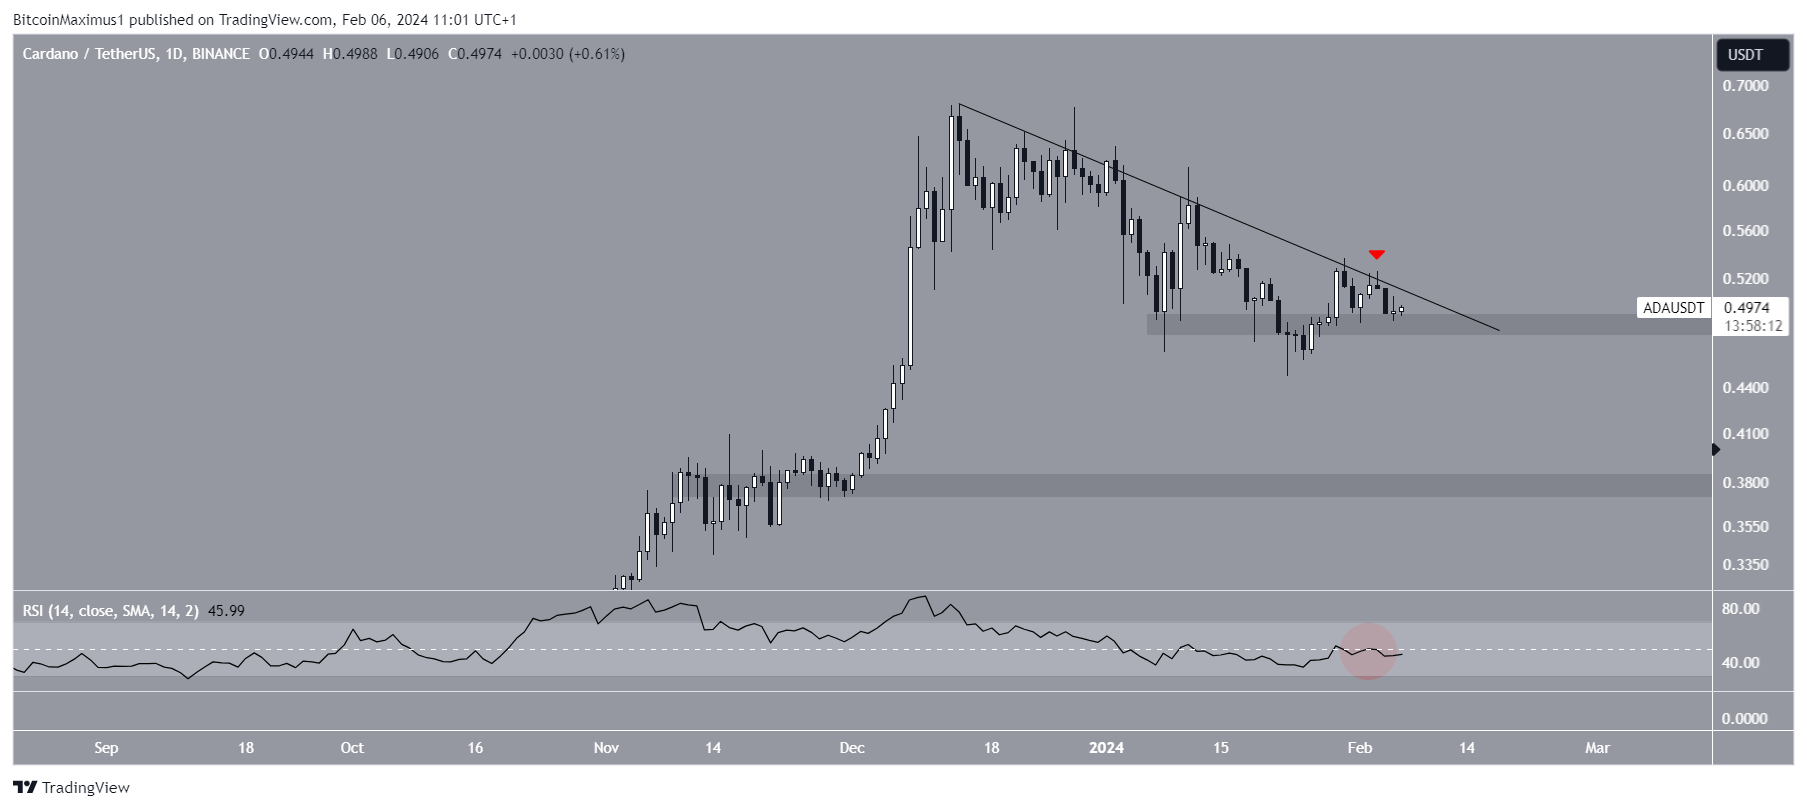
The daily Relative Strength Index (RSI) gives a mixed reading. When evaluating market conditions, traders use the RSI as a momentum indicator to determine whether a market is overbought or oversold and whether to accumulate or sell an asset.
If the RSI reading is above 50 and the trend is upward, bulls still have an advantage, but if the reading is below 50, the opposite is true. The indicator is below 50 (red circle) but increasing, failing to confirm the trend’s direction.
Read More: How To Stake Cardano (ADA)
ADA Price Prediction: What Happens Next?
The technical analysis of the short-term two-hour chart suggests the ADA trend is bearish because of the price action.
The ADA price recently broke down from an ascending support trend line in place since the bounce started on January 23. This is a sign that the upward movement has ended.
However, similarly to the daily time frame, the two-hour RSI is increasing but is below 50, a sign of a mixed trend.
Despite this seemingly bearish short-term outlook, Altcoin Daily believes Cardano will reach $4-5 in the next two years, while Ali Martinez suggests the Cardano price can reach $8 due to a previous fractal.
If ADA continues to fall, it can decrease by another 5% and reach the $0.47 minor support area. This would not cause a breakdown from the long-term horizontal support area.
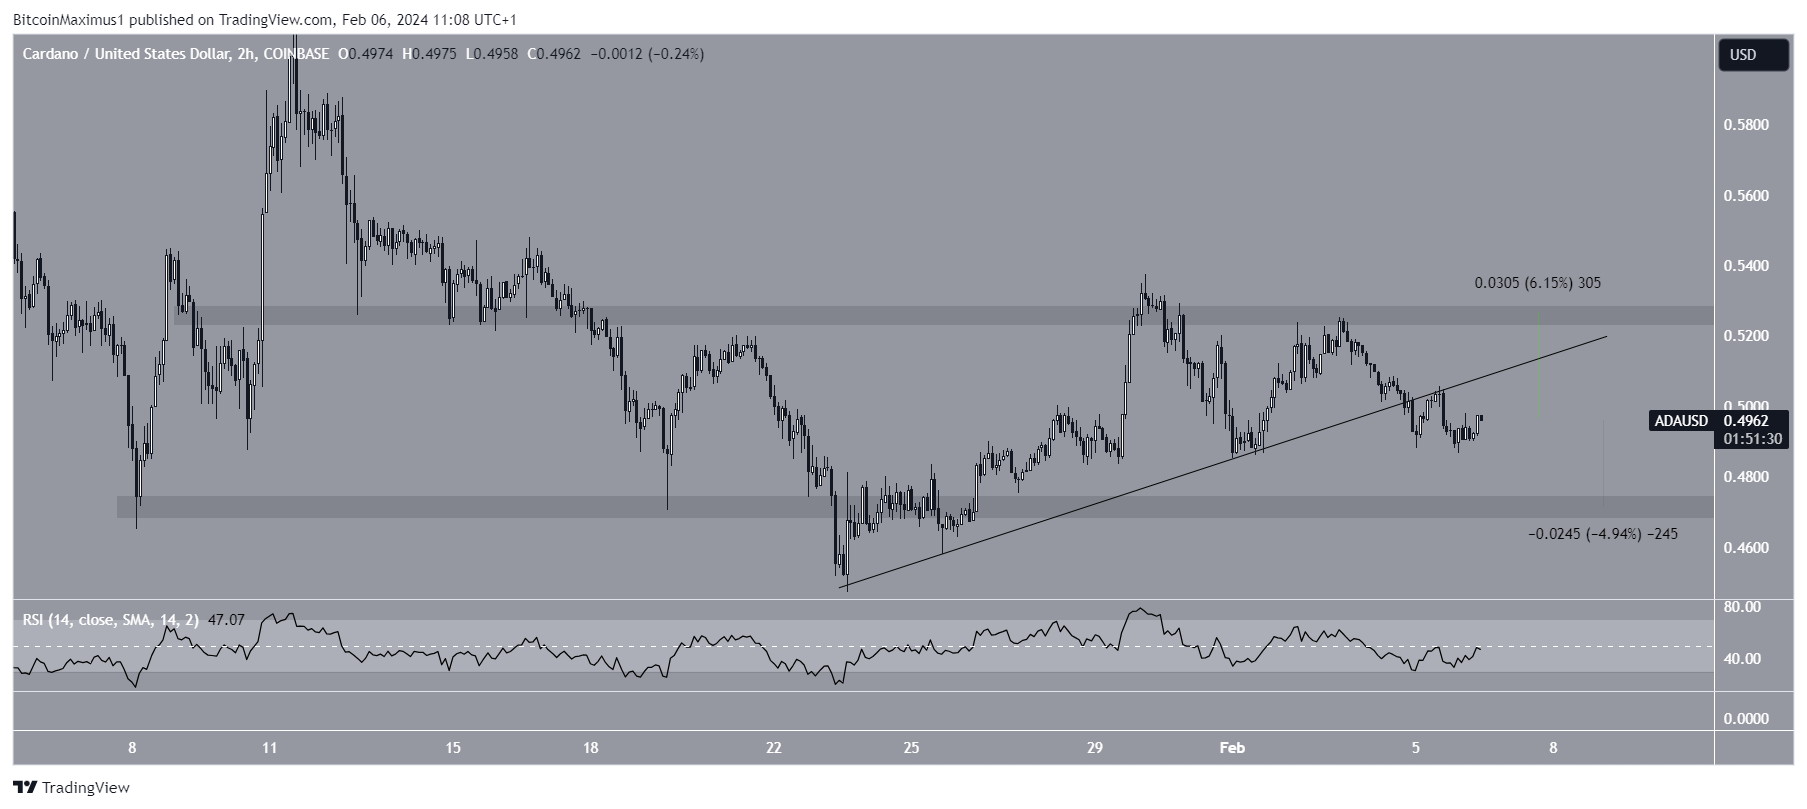
Even though the short-term ADA price prediction is bearish, reclaiming the ascending support trend line can initiate a 6% increase to the next resistance at $0.53.
For BeInCrypto‘s latest crypto market analysis, click here.
The post Cardano (ADA) Stalls at $0.50 Resistance – What’s in Store for February? appeared first on BeInCrypto.