

Here’s What This Dogecoin (DOGE) Pattern Reveals About the Future Trend
The Dogecoin (DOGE) price has consolidated in the past two months but is gradually gaining upward momentum.
DOGE broke out from a short-term resistance but still trades inside a long-term corrective pattern.
Dogecoin Consolidates Inside Corrective Pattern
The technical analysis of the daily time frame shows that DOGE has traded inside an ascending parallel channel since June 2023. The price seemingly broke out in December, reaching a new yearly high of $0.107.
However, the DOGE price has fallen since, validating the channel as resistance twice in January 2024 (red icon). Despite the DOGE rejection, it still trades in the pattern’s upper portion.
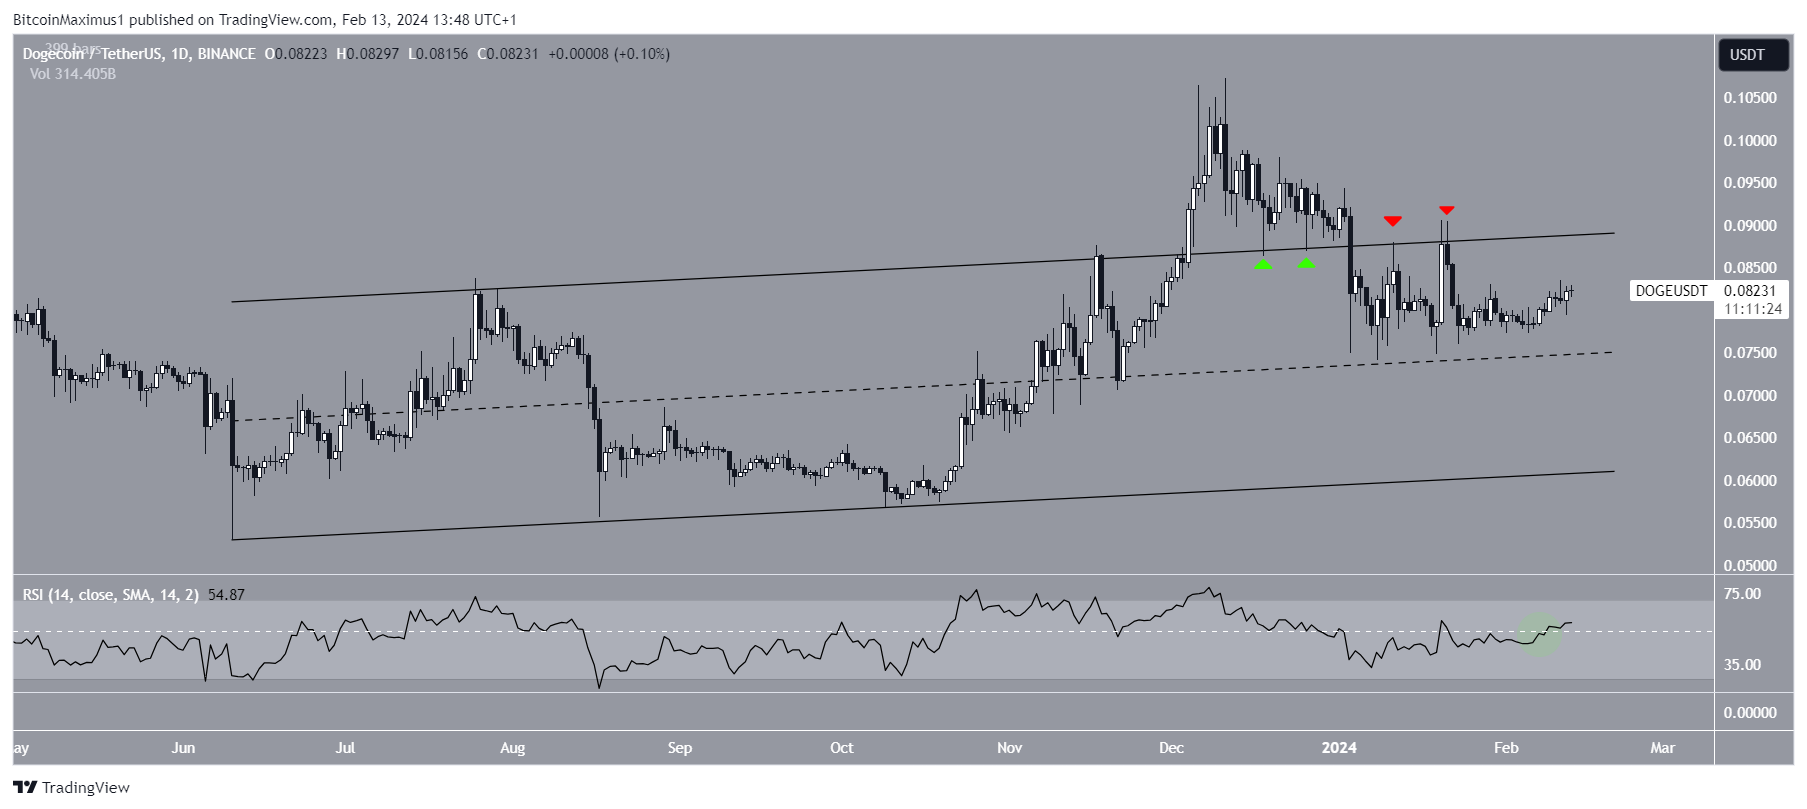
The daily Relative Strength Index (RSI) has turned bullish. When evaluating market conditions, traders use the RSI as a momentum indicator to determine whether a market is overbought or oversold and whether to accumulate or sell an asset.
If the RSI reading is above 50 and the trend is upward, bulls still have an advantage, but if the reading is below 50, the opposite is true. This week, the indicator increased above 50 (green icon), indicating a bullish trend.
Read More: Dogecoin vs. Bitcoin: An Ultimate Comparison
DOGE Price Prediction: Where to Next?
The six-hour time frame supports the ongoing bounce and suggests it will continue. This is because the DOGE price broke out from a descending resistance trend line on Feb. 9 and validated it as support four days later (green icon).
This is a common movement after breakouts and usually leads to trend continuation.
Read More: How to Buy Dogecoin (DOGE) Anonymously
The bounce is also supported by the RSI, which increased above 50 (green circle) once the Dogecoin price bounced at the trend line.
However, there is still a strong horizontal resistance level at $0.088, which coincides with the resistance trend line of the long-term channel.
If DOGE breaks out, it will confirm its trend reversal and can initiate a 25% increase to the next resistance at $0.102.
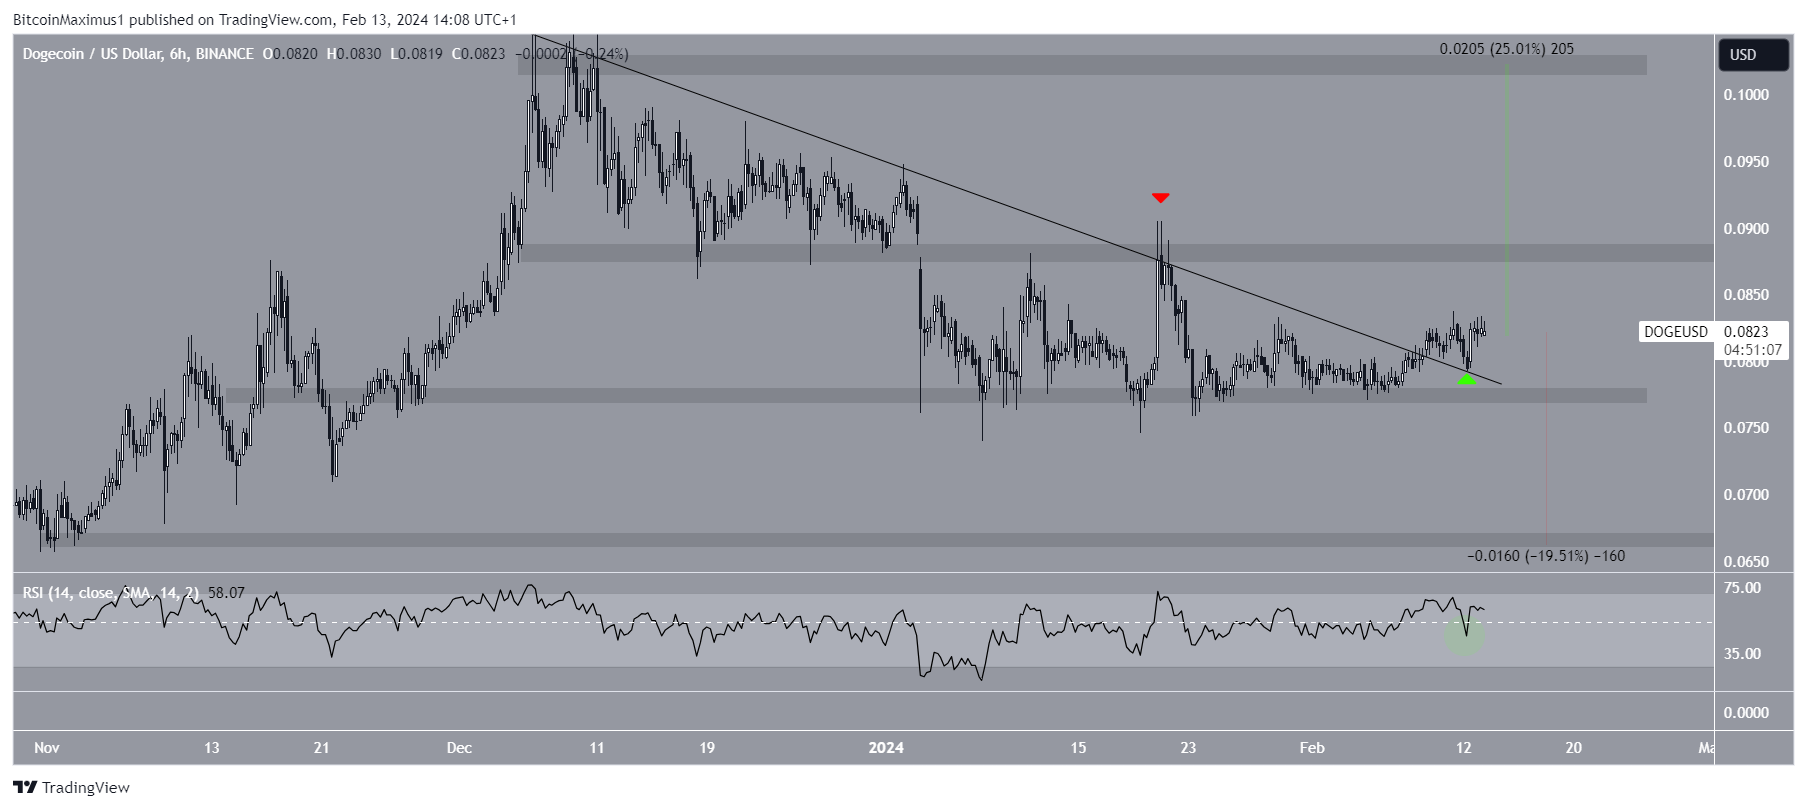
Despite the bullish DOGE price prediction, closing below the $0.078 area can trigger a 20% drop to the next closest support at $0.066.
Why Dogecoin Is The MOST Underrated Cryptocurrency – YouTube
For BeInCrypto‘s latest crypto market analysis, click here
The post Here’s What This Dogecoin (DOGE) Pattern Reveals About the Future Trend appeared first on BeInCrypto.