

Here’s Why This Channel Is Critical for the Future Avalanche (AVAX) Price Trend
The Avalanche (AVAX) price has decreased since a confluence of short-term resistances rejected it on February 15.
Despite the rejection, AVAX regained its footing yesterday and is attempting to reclaim the closest support. Will it be successful?
AVAX Begins Recovery
The daily time frame chart shows that AVAX has fallen under a descending resistance trend line since December 24, 2023. The decrease led to a low of $27.26 on January 23, 2024.
AVAX has increased since, validating the 0.5 Fib retracement support level (green icon) and breaking out from the descending resistance trend line. The upward movement culminated with a high of $43.62 on February 15 before the AVAX price decreased slightly.
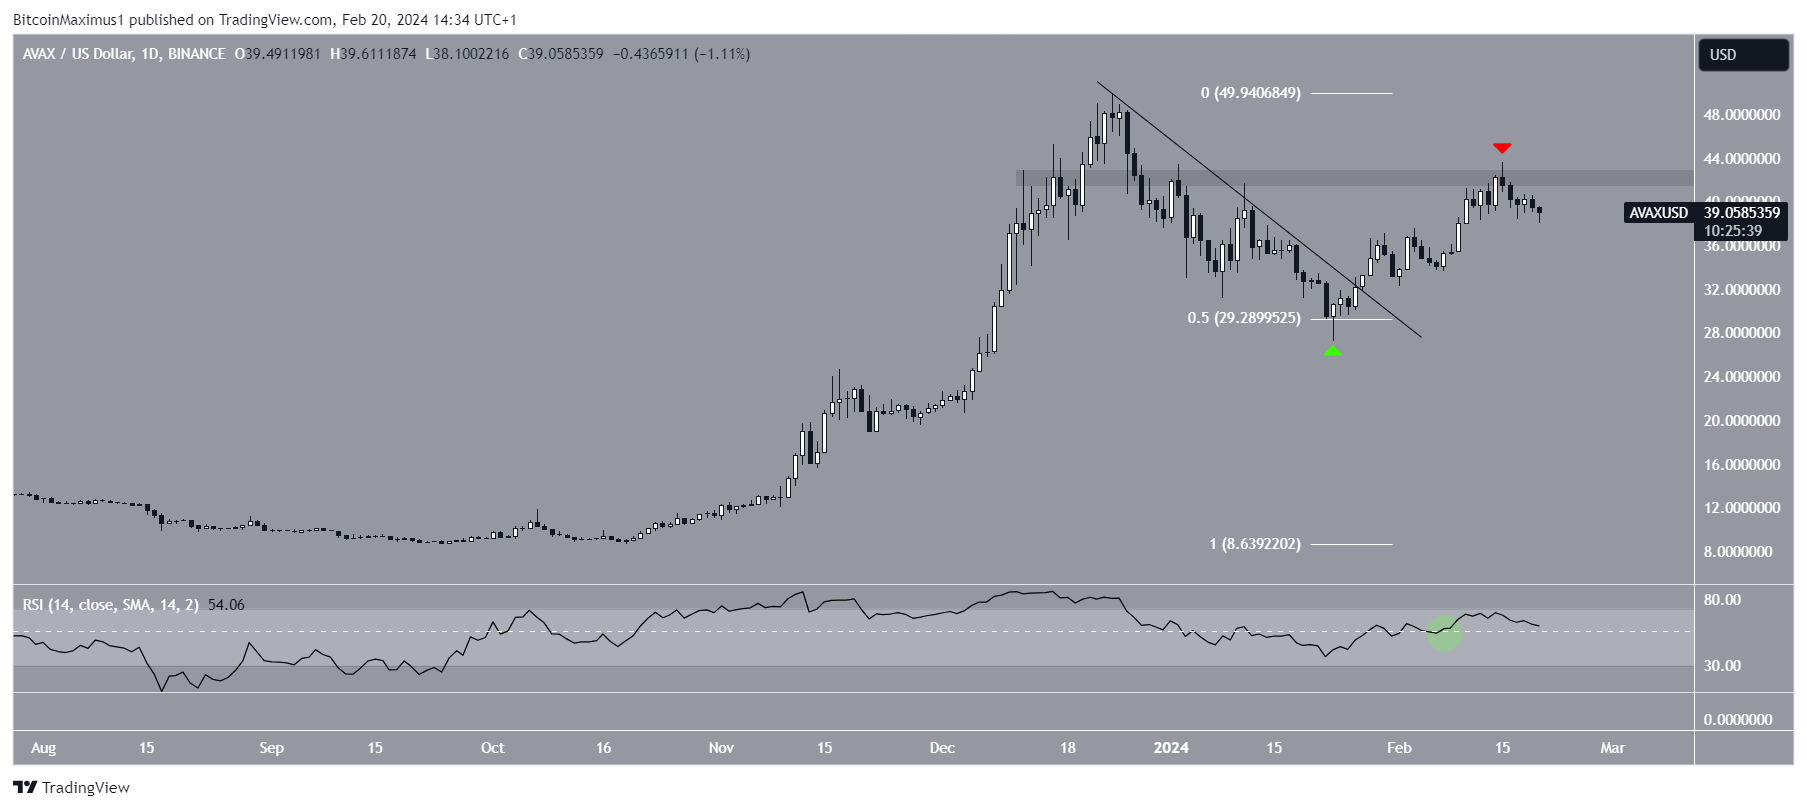
Despite the decrease, the Relative Strength Index (RSI) is still bullish. Traders utilize the RSI as a momentum indicator to assess whether a market is overbought or oversold and whether to accumulate or sell an asset.
Read More: Buy Avalanche (AVAX) With a Credit Card
If the RSI reading is above 50 and the trend is upward, bulls still have an advantage, but if the reading is below 50, the opposite is true. The indicator moved above 50 (green circle) shortly after the price broke out and is still above the threshold.
AVAX Price Prediction: Can Price Stave Off Breakdown?
Unlike the daily time frame, which is bullish, the shorter-term six-hour chart provides a mixed reading because of the price action and RSI readings.
The AVAX price has fallen since deviating above the 0.618 Fib retracement resistance level (red circle) on February 15.
Read More: Buy Avalanche (AVAX)
Additionally, AVAX broke down from an ascending parallel channel yesterday. Despite the breakdown, it trades close to the channel’s support trend line.
However, the breakdown also caused the RSI to decrease below 50, another bearish sign.
So, whether AVAX reclaims the channel’s support trend line or falls below it will determine the future trend’s direction.
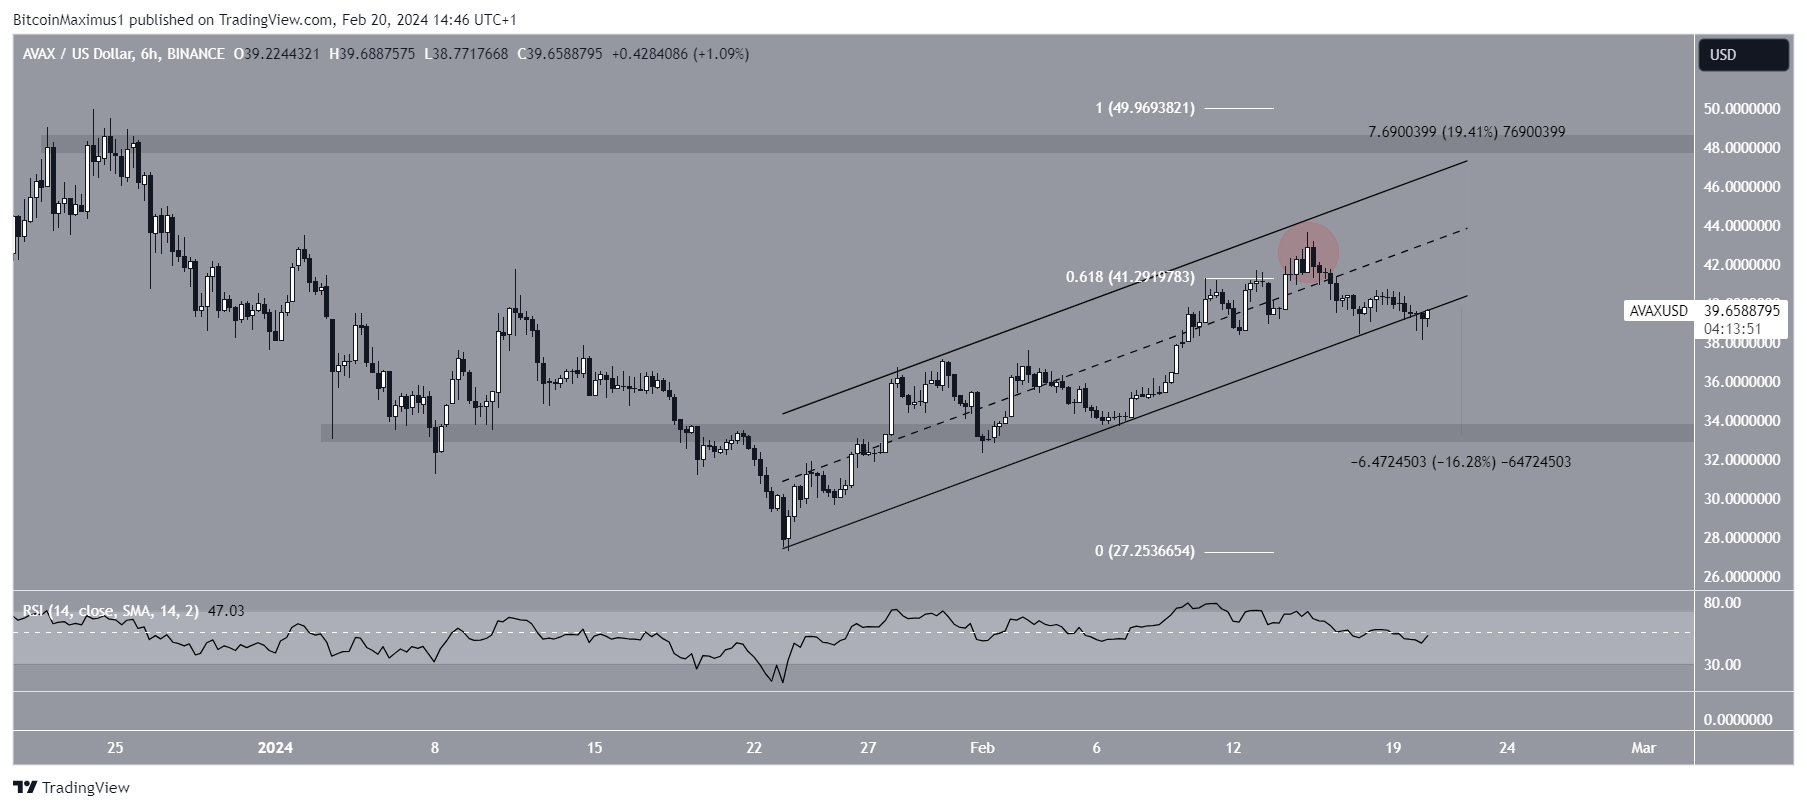
Reclaiming the support trend line can lead to a 20% increase in its resistance trend line at $48. Conversely, a rejection from the trend line can trigger a 16% AVAX drop to the closest support at $33.
For BeInCrypto‘s latest crypto market analysis, click here.
The post Here’s Why This Channel Is Critical for the Future Avalanche (AVAX) Price Trend appeared first on BeInCrypto.