
Is This Historical Bitcoin Bull Run Pattern Finally Forming?
On-chain data suggests a Bitcoin indicator may finally form a pattern historically associated with bull runs.
Bitcoin Long-Term Holders Have Reversed Their Trend Recently
According to data from the market intelligence platform IntoTheBlock, the recent activity of the hodlers has been typical for bull markets in the past. IntoTheBlock defines “hodlers” as investors who have held their Bitcoin since at least one year ago.
More specifically, the addresses that have kept their coins still on the blockchain for at least a year (that is, they haven’t involved the coins in any transactions) qualify as long-term holders (LTHs).
Note that the cutoff for the LTHs used by other analytics firms ranges between five to six months, which differs from the one-year threshold used by IntoTheBlock.
The hodlers include the most relentless hands of the sector, who don’t sell easily no matter whether FUD has enveloped the market or an enticing profit-taking opportunity has appeared.
As such, the times that the LTHs start selling can be notable. One way to track the behavior of the hodlers is through the combined amount of BTC they currently carry in their wallets.
Here is a chart that shows the trend in the total Bitcoin balance of the hodlers over the last few years:
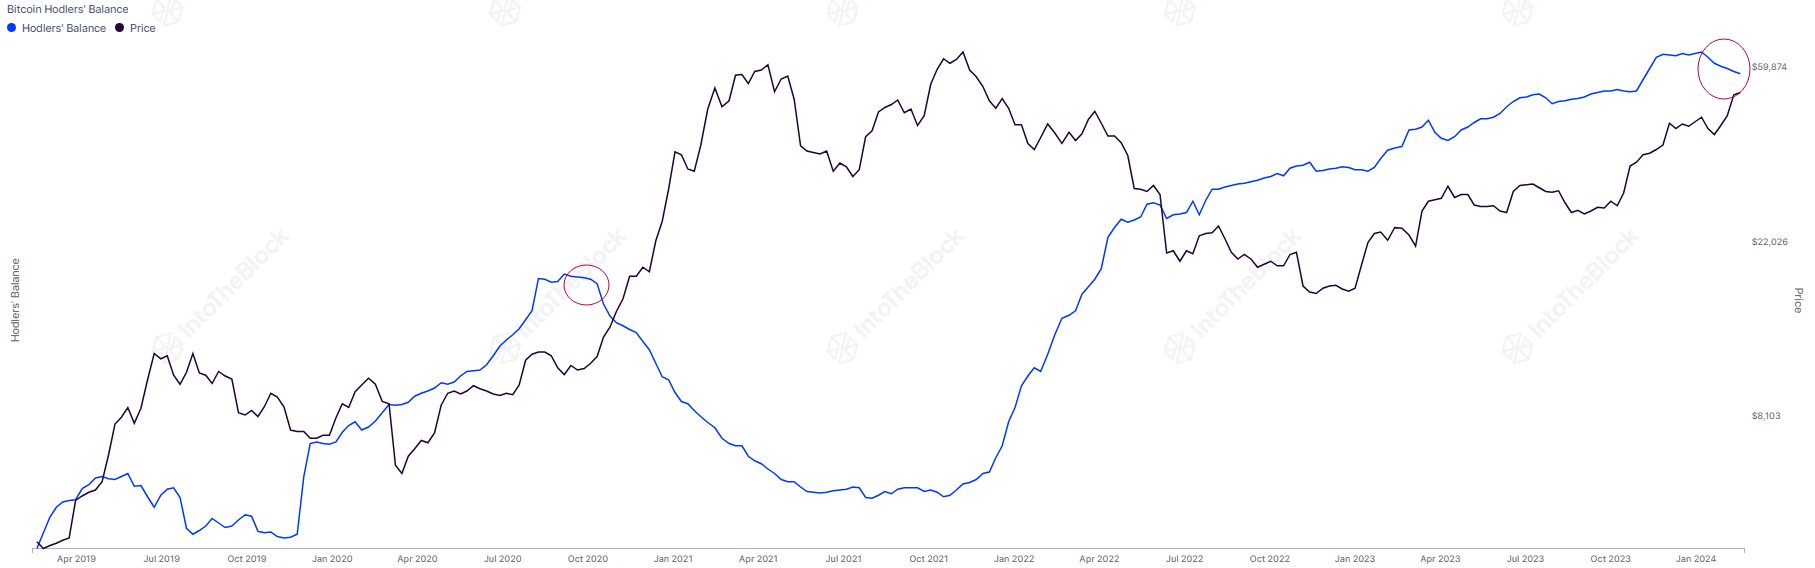
Looks like the value of the metric has been heading down in recent weeks | Source: IntoTheBlock on X
As displayed in the above graph, the Bitcoin hodlers had been continuously adding to their balance since the end of the 2021 bull run, until very recently, where the indicator’s trend appears to have gone through a reversal.
Something to keep in mind is that any increases in the metric don’t suggest that buying is happening in the present. Rather, they imply that some buying occurred a year ago, and these coins have matured enough to become a part of the cohort.
This same delay, though, isn’t associated with selling. When the holders shift their coins, their age instantly resets back to zero, thus leading to them being removed from the group.
As such, it would appear that the LTHs have taken to selling recently. “Long-term BTC holders have sold approximately 200k BTC from their collective balances since the beginning of the year, marking nearly 3 months of consecutive net decreases,” notes the analytics firm.
Interestingly, a similar pattern was witnessed as the 2021 bull run kicked off, as IntoTheBlock has highlighted in the chart. It would appear that the LTHs had also stopped accumulating back then and had taken to selling like they have now.
In total, the Bitcoin hodlers went on to reduce their holdings by 15% throughout the bull run, while so far in the current rally, they have shed about 1.5% of their reserves.
BTC Price
At the time of writing, Bitcoin is trading around the $51,000 level, down 2% over the past week.
The price of the asset appears to have been declining recently | Source: BTCUSD on TradingView
Featured image from Shutterstock.com, IntoTheBlock.com, chart from TradingView.com