

Ripple (XRP) Price Rebounds Signaling Bullish Breakthrough
A few days ago, Ripple (XRP) experienced a bullish rebound, signaling the initiation of an upward trajectory. The question now remains whether Ripple will successfully surpass the current resistance levels.
Yesterday, Ripple encountered notable resistance, leading to an initial bearish rejection in price action. The pivotal query centers on whether Ripple will manage to overcome these resistance barriers today.
XRP Price Rallies from Golden Ratio Support at $0.475: What’s Next?
About a week ago, XRP found support at the golden ratio around $0.475, sparking a bullish rebound. Subsequently, Ripple embarked on an upward trajectory, reaching resistance at the 200-day EMA near $0.567 yesterday.
However, Ripple faced initial bearish rejection at this level. Nonetheless, the Moving Average Convergence/Divergence indicator (MACD) indicator continues to exhibit bullish signals.
With the MACD histogram trending upward and the MACD lines crossing bullishly, coupled with a neutral Relative Strength Index (RSI), XRP may attempt another breakthrough of the 200-day EMA resistance at approximately $0.57 today.
Read More: Everything You Need To Know About Ripple vs SEC
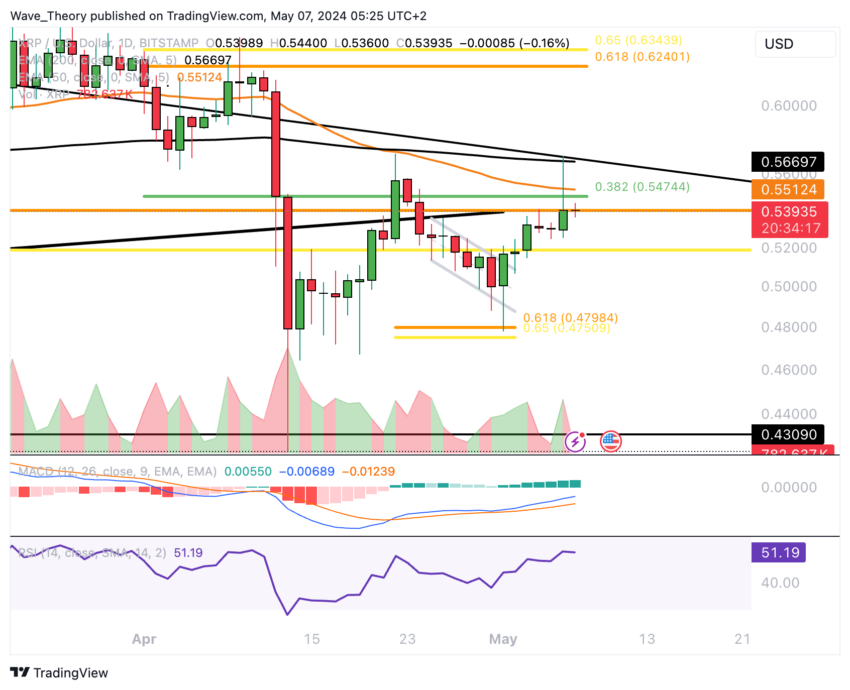
A successful breach of the 200-day EMA could propel Ripple towards the golden ratio resistance at $0.63. Only upon surpassing this Fibonacci level would the corrective movement be invalidated.
Additionally, a death cross was observed in the daily chart a few days ago, affirming the bearish trend in the short to medium term.
Ripple’s 4H Chart Signals Trouble: Death Cross Analysis
In Ripple’s 4-hour chart, a death cross has emerged in the EMAs, solidifying the bearish trend in the short term.
Moreover, the MACD lines are on the verge of a bearish crossover, signaling further downside potential.
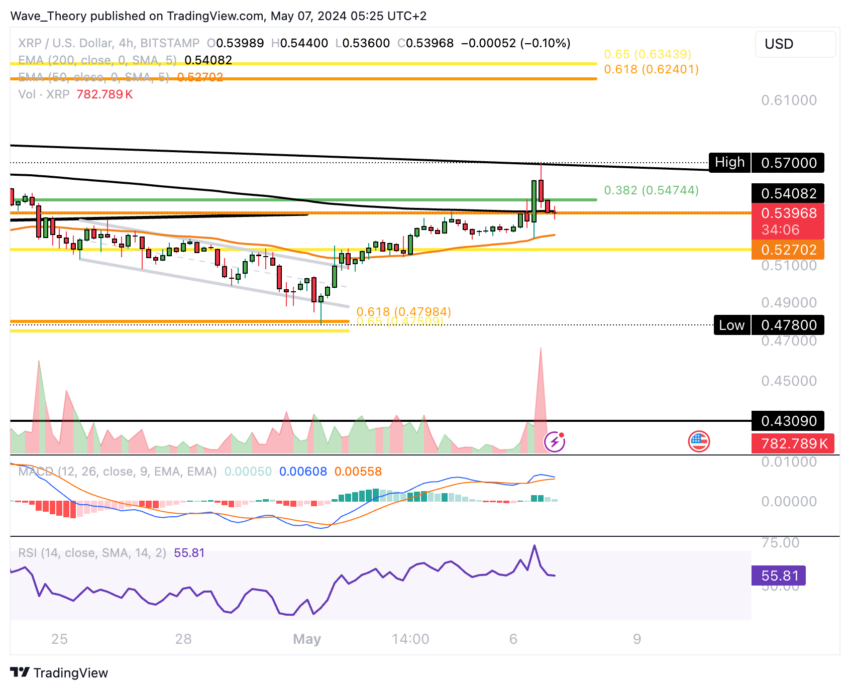
The MACD histogram has already commenced a downward trajectory in a bearish manner, while the RSI remains neutral.
Ripple’s Weekly Chart Shows Bullish MACD Trends
Ripple’s weekly chart shows a bullish uptick in the MACD histogram since last week. However, the MACD lines remain bearishly crossed, and the RSI maintains a neutral stance.
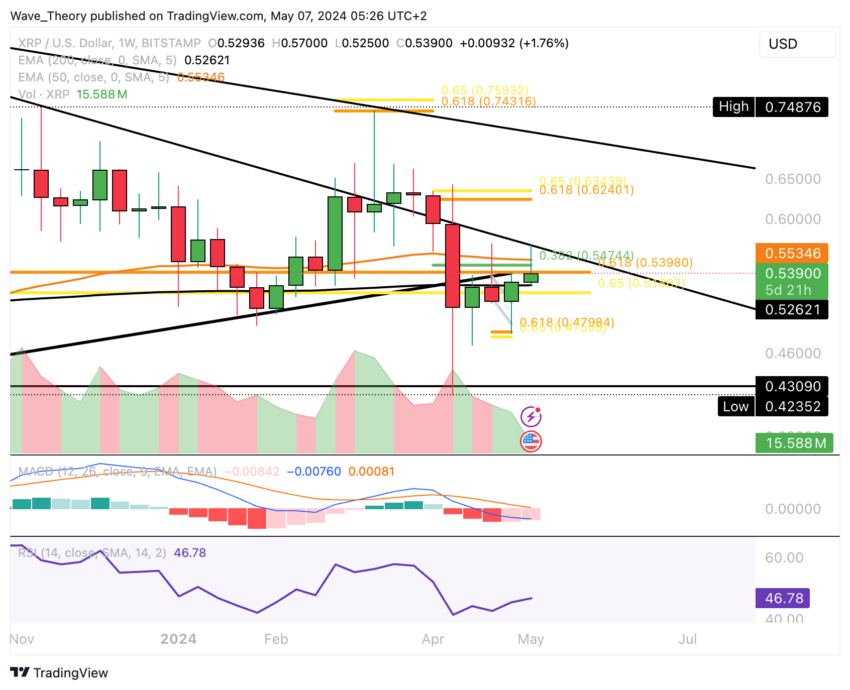
XRP is currently encountering notable resistance at the .382 Fib level around $0.55, with the 50-week EMA adding further resistance at this level.
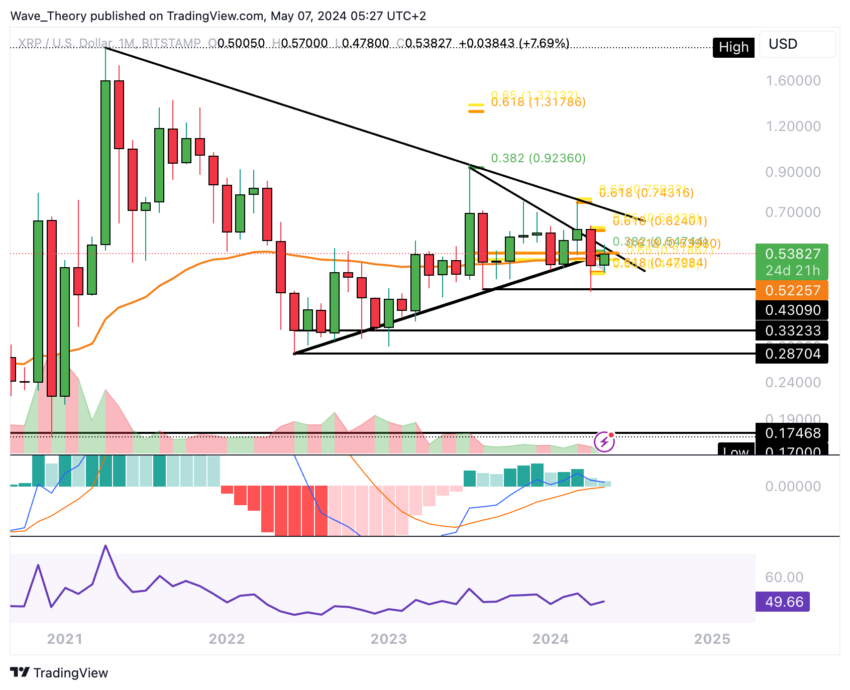
Monthly MACD Histogram Moves Lower
The monthly chart shows a potential for a bearish crossover looming in the MACD lines, as indicated by the downward trend in the MACD histogram since last month.
The RSI remains in neutral territory, signaling neither bullish nor bearish sentiment.
Read More: Ripple (XRP) Price Prediction 2024/2025/2030
Should XRP break below the golden ratio support at approximately $0.475, the subsequent significant support level lies around $0.43.
XRP vs. BTC: Potential Price Correction to Key Support Level
Ripple may further decline against BTC until it reaches the support level of around 0.0000062 BTC. While the MACD lines currently show a bearish crossover, there are indications of a bullish uptick in the MACD histogram for the current month.
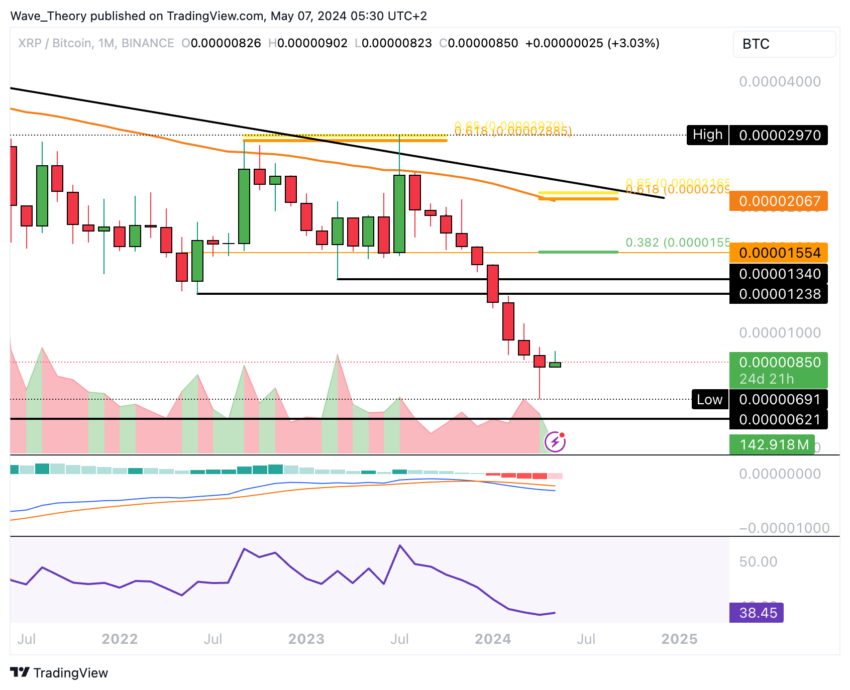
Conversely, significant resistance is anticipated for Ripple between approximately 0.0000124 BTC and 0.0000134 BTC on the upside.
The post Ripple (XRP) Price Rebounds Signaling Bullish Breakthrough appeared first on BeInCrypto.