
This Is Why Cardano (ADA) Price Is Potentially on the Cusp of a 15% Correction
Cardano’s price had an impressive start in March, but this momentum slowed over the past few days. ADA is now threatened by a potential correction that could wipe out a large chunk of its recently noted gains.
But what happens if the third-generation cryptocurrency manages to validate this bullish pattern from December?
Cardano Price Is on the Way
Cardano’s price rose by more than 13% in the past week, trading at $0.72 at the time of writing. However, it is having difficulty sustaining this rally since it is slipping below the local support of $0.72.
This level would need to be turned into a support floor for ADA to rise further. But since the altcoin is already losing its bullish momentum, investors might opt to sell. The MVRV ratio gauges investors’ average profit or loss when acquiring an asset. Specifically, the 30-day MVRV evaluates this metric for investors who obtained the asset within the last month.
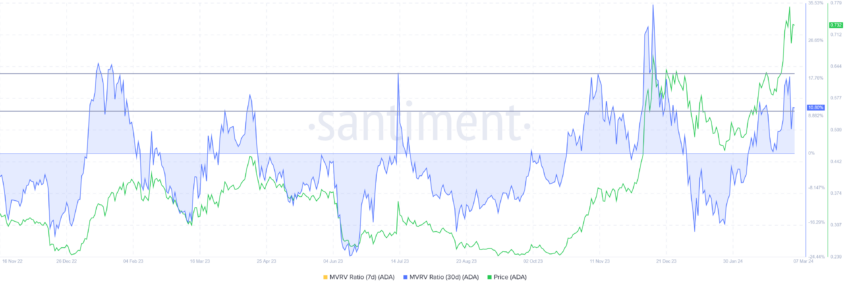
For Cardano, the 30-day MVRV sits at 10.8%, which indicates that investors who purchased ADA in the past month are sitting at 10.8% profit. These investors would likely sell their holdings to book profits, which could trigger a sell-off. The chart shows that ADA undergoes major corrections when MVRV hits 10% to 20%. Hence, this area is termed a danger zone.
A selling spree will create a chain reaction, sending ADA to $0.68. This price is the upper limit of the cluster of 5.23 billion ADA worth $3.8 billion, bought between $0.59 and $0.68.
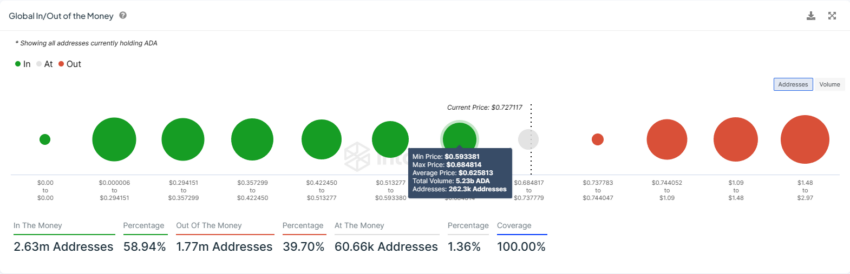
If these investors fear losses and opt to sell, Cardano’s price could lose this support too and decline to the next critical support level of $0.62, marking a 15% decline.
ADA Price Prediction: This One Move Could Prevent a Drop
Over the past two months, Cardano has been observing a rounding bottom pattern formation. The rounding bottom pattern is a technical pattern that signals a potential bullish reversal in a downtrend.
It forms when the price of an asset reaches a low point, then gradually rises, forming a curved or rounded bottom. This pattern suggests a shift from selling pressure to buying pressure, and once the price breaks above the pattern’s resistance level, it indicates a bullish trend continuation or reversal.
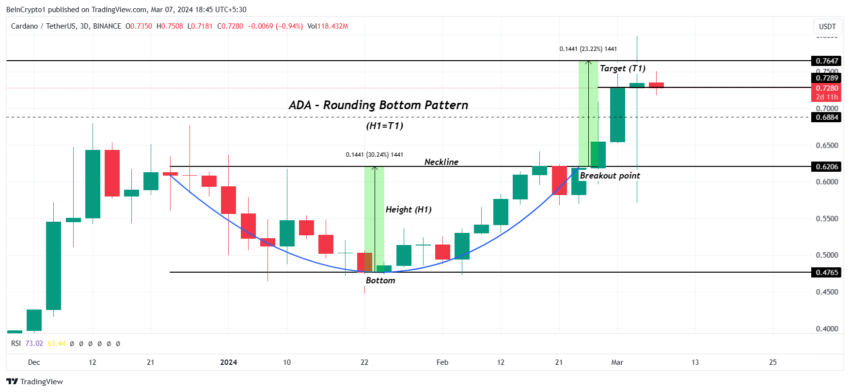
In the case of ADA, the breakout point is marked at $0.62, which forms the neckline. Per the height of the pattern, the target is $0.76. Cardano would meet this pattern if it manages to rally by another 6%.
Should this pattern be validated, ADA would find the necessary boost to breach the $0.76 barrier, invalidate the bearish thesis, and rally toward $0.80.
The post This Is Why Cardano (ADA) Price Is Potentially on the Cusp of a 15% Correction appeared first on BeInCrypto.